

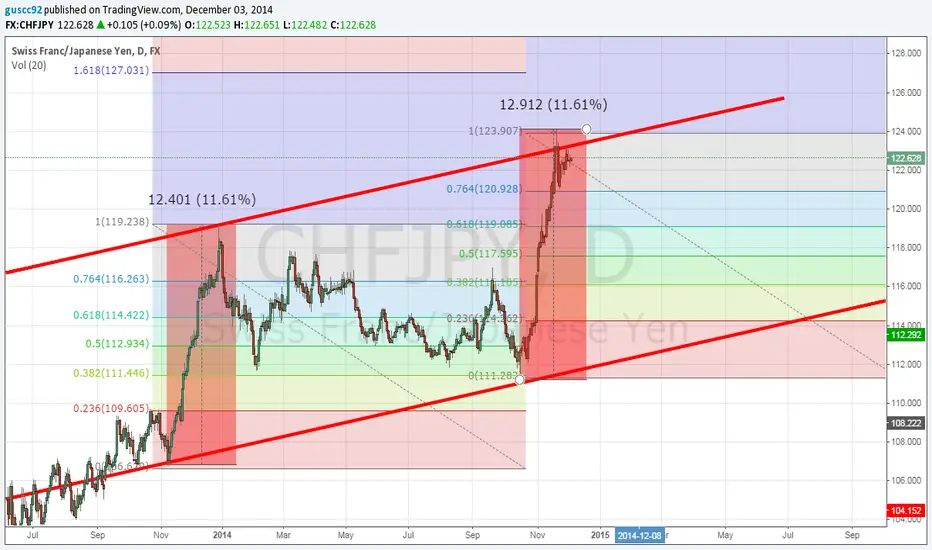
There is a marked long trend tendency with similar resistance and support lines.
Inside that, we can see how the bullish price is strong and has had a retracement of 61.8%.
Both fibonacci are exactly the same, and as we can see, the story seems to repeat.
We can also see how both range have exactly the same % with very similar price unit ranges.
Inside that, we can see how the bullish price is strong and has had a retracement of 61.8%.
Both fibonacci are exactly the same, and as we can see, the story seems to repeat.
We can also see how both range have exactly the same % with very similar price unit ranges.

Exención de responsabilidad
La información y las publicaciones no constituyen, ni deben considerarse como, asesoramiento o recomendaciones financieras, de inversión, de trading u otro tipo, proporcionadas o respaldadas por TradingView. Obtenga más información en Condiciones de uso.
Exención de responsabilidad
La información y las publicaciones no constituyen, ni deben considerarse como, asesoramiento o recomendaciones financieras, de inversión, de trading u otro tipo, proporcionadas o respaldadas por TradingView. Obtenga más información en Condiciones de uso.