
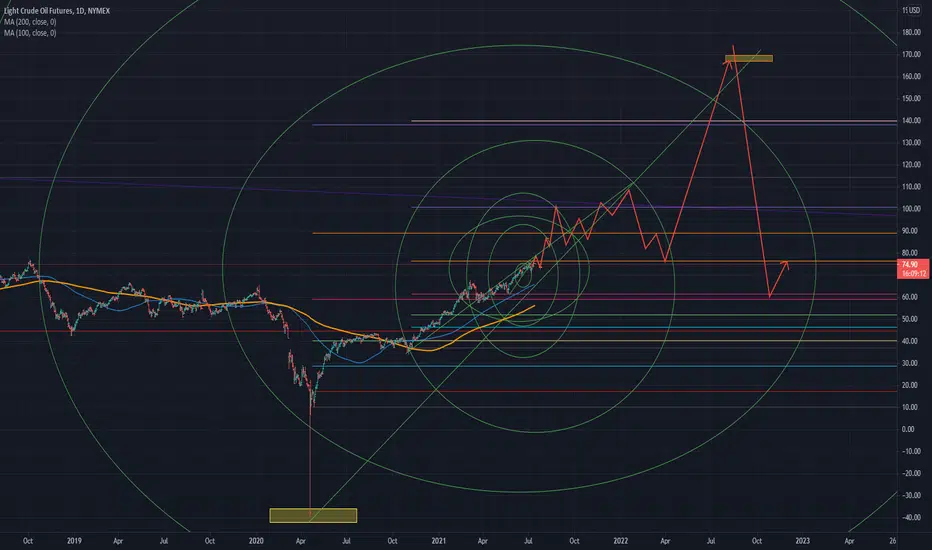
I used Fibonacci circles and used extensions. It is a prediction chart using wave properties. According to this chart, after hitting the $100 range in September of this year and falling, it rises again to $100 in early 2022, and then renews the highest price in 2022 after the decline.
Remember, this is just a personal scenario, not an exact calculation. The choice is yours
Remember, this is just a personal scenario, not an exact calculation. The choice is yours

Exención de responsabilidad
La información y las publicaciones no constituyen, ni deben considerarse como, asesoramiento o recomendaciones financieras, de inversión, de trading u otro tipo, proporcionadas o respaldadas por TradingView. Obtenga más información en Condiciones de uso.
Exención de responsabilidad
La información y las publicaciones no constituyen, ni deben considerarse como, asesoramiento o recomendaciones financieras, de inversión, de trading u otro tipo, proporcionadas o respaldadas por TradingView. Obtenga más información en Condiciones de uso.