
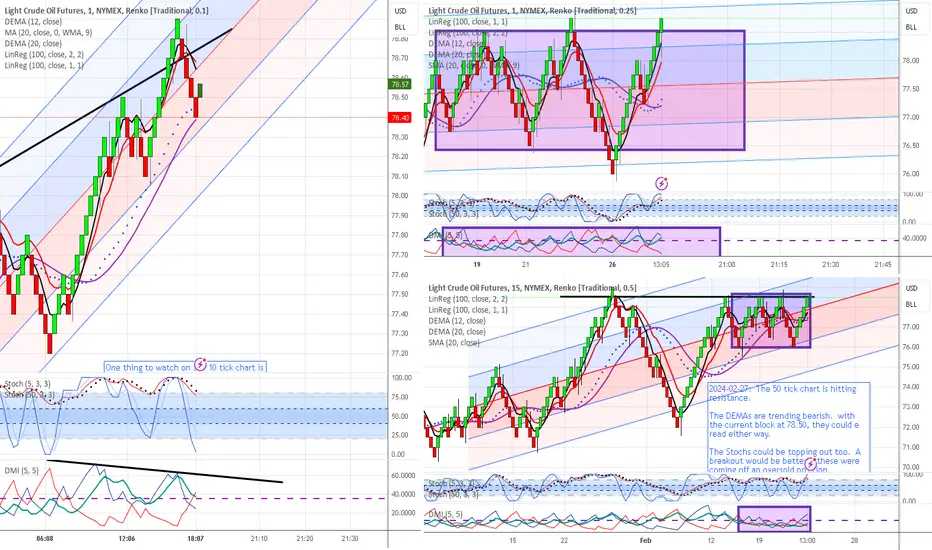
This is a current view of CL and some details on the consolidation that is showing up on the 50 and 25 tick charts. February resistance levels are getting tested again. The 10-tick short-term chart has shown some strength but now showing divergence as price hits the larger blocks resistance levels.
10-tick chart

25-tick chart

50-tick chart

10-tick chart
25-tick chart
50-tick chart

Publicaciones relacionadas
Exención de responsabilidad
La información y las publicaciones no constituyen, ni deben considerarse como, asesoramiento o recomendaciones financieras, de inversión, de trading u otro tipo, proporcionadas o respaldadas por TradingView. Obtenga más información en Condiciones de uso.
Publicaciones relacionadas
Exención de responsabilidad
La información y las publicaciones no constituyen, ni deben considerarse como, asesoramiento o recomendaciones financieras, de inversión, de trading u otro tipo, proporcionadas o respaldadas por TradingView. Obtenga más información en Condiciones de uso.