
Concor India - Potential Double Bottom Breakout underway
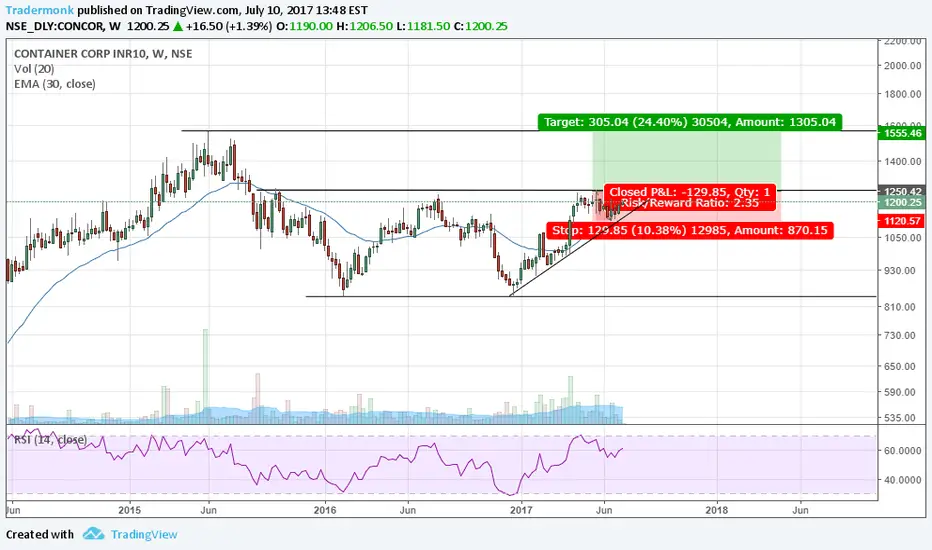
Potential Double bottom pattern (Adam & Adam formation) awaiting upward breakout observed in Concor India Ltd weekly chart.
Resistance zone is at 1200-1250 levels. A close above 1250 with higher volumes would indicate confirmation of the Double Bottom pattern formation which is a bullish sign for the stock.
Swing Trading Strategy :
Buy : Above 1250 level (on closing basis)
Target : 1550 (Old Resistance level as on 1st June 2015)
Stop Loss : Below 1120
Trade Safe !!!
Note : I have no current positions in this stock but may enter a position or multiple positions in the coming days and weeks.
Resistance zone is at 1200-1250 levels. A close above 1250 with higher volumes would indicate confirmation of the Double Bottom pattern formation which is a bullish sign for the stock.
Swing Trading Strategy :
Buy : Above 1250 level (on closing basis)
Target : 1550 (Old Resistance level as on 1st June 2015)
Stop Loss : Below 1120
Trade Safe !!!
Note : I have no current positions in this stock but may enter a position or multiple positions in the coming days and weeks.
Operación activa
Closed above 1250
Exención de responsabilidad
La información y las publicaciones no constituyen, ni deben considerarse como, asesoramiento o recomendaciones financieras, de inversión, de trading u otro tipo, proporcionadas o respaldadas por TradingView. Obtenga más información en Condiciones de uso.
Exención de responsabilidad
La información y las publicaciones no constituyen, ni deben considerarse como, asesoramiento o recomendaciones financieras, de inversión, de trading u otro tipo, proporcionadas o respaldadas por TradingView. Obtenga más información en Condiciones de uso.