Actualizado
Wait & watch
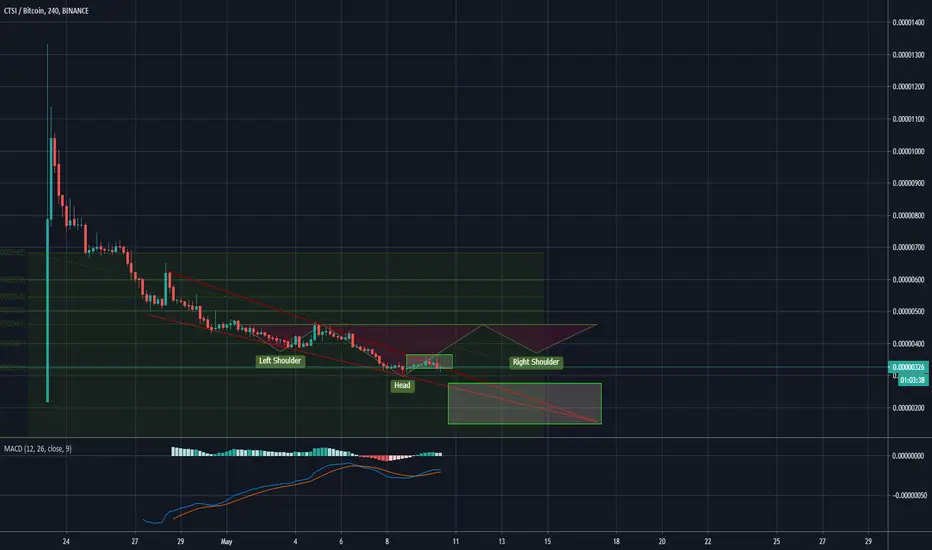
After last positive analysis, CTSI has fallen back into his downtrend falling wedge pattern.
Best buy for us would be when we breakout with volume out of this wedge which is indicated with a green rectangle box.
Alternatively, accumulation range would be between 150-250 sats from which we can expect a upward movement confidently.
Regards
Best buy for us would be when we breakout with volume out of this wedge which is indicated with a green rectangle box.
Alternatively, accumulation range would be between 150-250 sats from which we can expect a upward movement confidently.
Regards
Operación activa
Trying to break out of the 4 step downward parabolic curve formation, The volume is there but i would personally be weary to enter the trade when BTC is at the crucial juncture of 10k.
CTSI needs to break 417sats to break from the primary resistance of the curve.
Operación cerrada: objetivo alcanzado

Publicaciones relacionadas
Exención de responsabilidad
La información y las publicaciones no constituyen, ni deben considerarse como, asesoramiento o recomendaciones financieras, de inversión, de trading u otro tipo, proporcionadas o respaldadas por TradingView. Obtenga más información en Condiciones de uso.
Publicaciones relacionadas
Exención de responsabilidad
La información y las publicaciones no constituyen, ni deben considerarse como, asesoramiento o recomendaciones financieras, de inversión, de trading u otro tipo, proporcionadas o respaldadas por TradingView. Obtenga más información en Condiciones de uso.