
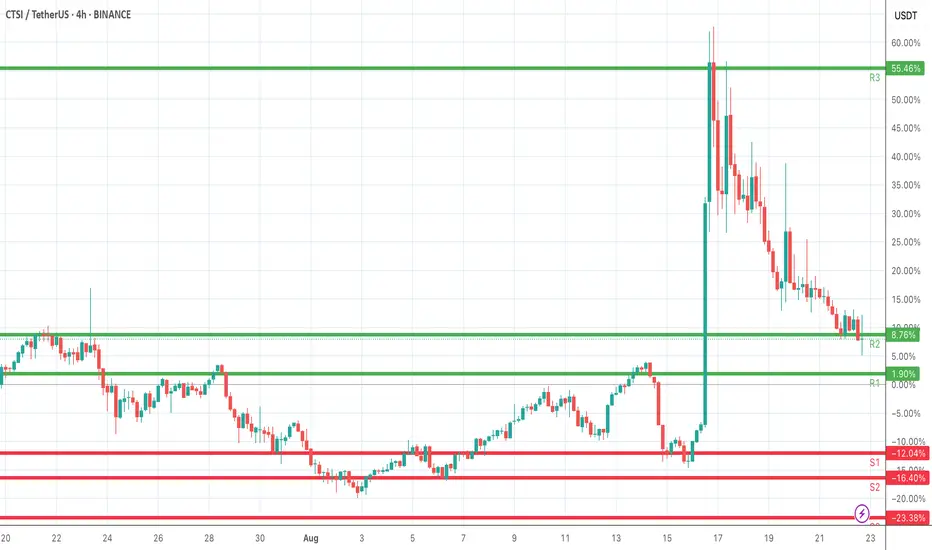
CTSI/USDT 4H chart
Levels:
• Resistance (R3): ~55.46%
• Resistance (R2): ~8.76%
• Resistance (R1): ~1.90%
• Support (S1): ~-12.04%
• Support (S2): ~-16.40%
• Support Zone: extends toward ~-23.38%
What the chart shows:
1. Price pumped hard to R3 (55.46%) but got rejected strongly.
2. Now it’s consolidating near R2 (8.76%), struggling to hold above it.
3. If it loses momentum, it may retest R1 (1.90%) or even dip into the support zone (S1–S2).
4. For a bullish move again, price must break and hold above R2 → R3, which seems like a tough resistance zone.
Trading perspective:
• Bullish case: If CTSI bounces above R2 and sustains, it could attempt another leg up.
• Bearish case: If it fails to hold R2, we might see a drop toward S1/S2.
At the moment, momentum looks weakened (lots of red candles after the big pump), so it may consolidate or retest support before any big move.
Levels:
• Resistance (R3): ~55.46%
• Resistance (R2): ~8.76%
• Resistance (R1): ~1.90%
• Support (S1): ~-12.04%
• Support (S2): ~-16.40%
• Support Zone: extends toward ~-23.38%
What the chart shows:
1. Price pumped hard to R3 (55.46%) but got rejected strongly.
2. Now it’s consolidating near R2 (8.76%), struggling to hold above it.
3. If it loses momentum, it may retest R1 (1.90%) or even dip into the support zone (S1–S2).
4. For a bullish move again, price must break and hold above R2 → R3, which seems like a tough resistance zone.
Trading perspective:
• Bullish case: If CTSI bounces above R2 and sustains, it could attempt another leg up.
• Bearish case: If it fails to hold R2, we might see a drop toward S1/S2.
At the moment, momentum looks weakened (lots of red candles after the big pump), so it may consolidate or retest support before any big move.

Exención de responsabilidad
La información y las publicaciones no constituyen, ni deben considerarse como, asesoramiento o recomendaciones financieras, de inversión, de trading u otro tipo, proporcionadas o respaldadas por TradingView. Obtenga más información en Condiciones de uso.
Exención de responsabilidad
La información y las publicaciones no constituyen, ni deben considerarse como, asesoramiento o recomendaciones financieras, de inversión, de trading u otro tipo, proporcionadas o respaldadas por TradingView. Obtenga más información en Condiciones de uso.