Actualizado
Inverse H&S Formation?
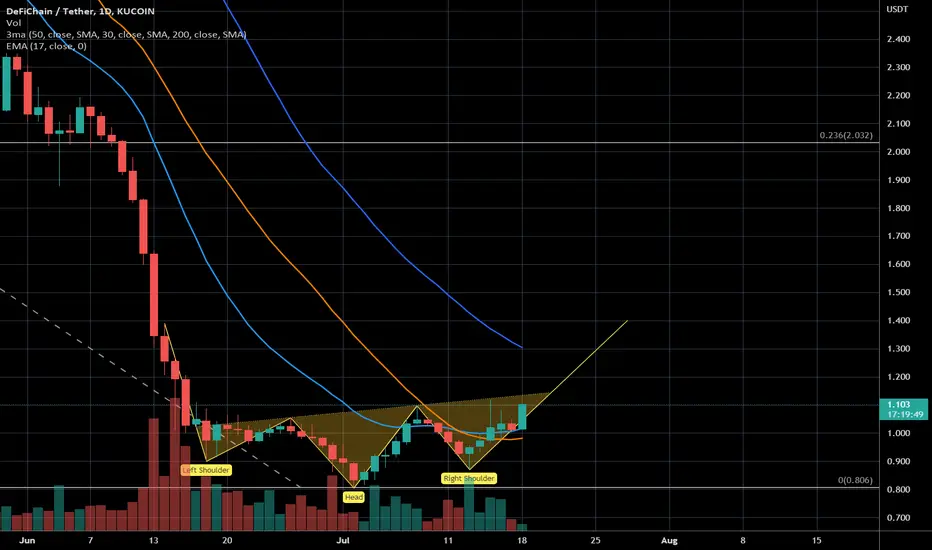
You can see an inverse H&S chart pattern is forming in DFI/USDT. We have broken the EMA 17 and SMA 30 already to the upside - the SMA 50 could offer a bit more resistance at currently 1.30 USD.
For me it seems like the crypto market could reverse (see also the BTC/USD chart) - not to approach the ATHs but to make a first move to the upside. We'll see.
For me it seems like the crypto market could reverse (see also the BTC/USD chart) - not to approach the ATHs but to make a first move to the upside. We'll see.
Nota
It was going a bit longer sideways then I've expected - you may extend the right line further to the right. However - it seems that the formation has successfully broken to the upside.
Publicaciones relacionadas
Exención de responsabilidad
La información y las publicaciones no constituyen, ni deben considerarse como, asesoramiento o recomendaciones financieras, de inversión, de trading u otro tipo, proporcionadas o respaldadas por TradingView. Obtenga más información en Condiciones de uso.
Publicaciones relacionadas
Exención de responsabilidad
La información y las publicaciones no constituyen, ni deben considerarse como, asesoramiento o recomendaciones financieras, de inversión, de trading u otro tipo, proporcionadas o respaldadas por TradingView. Obtenga más información en Condiciones de uso.