
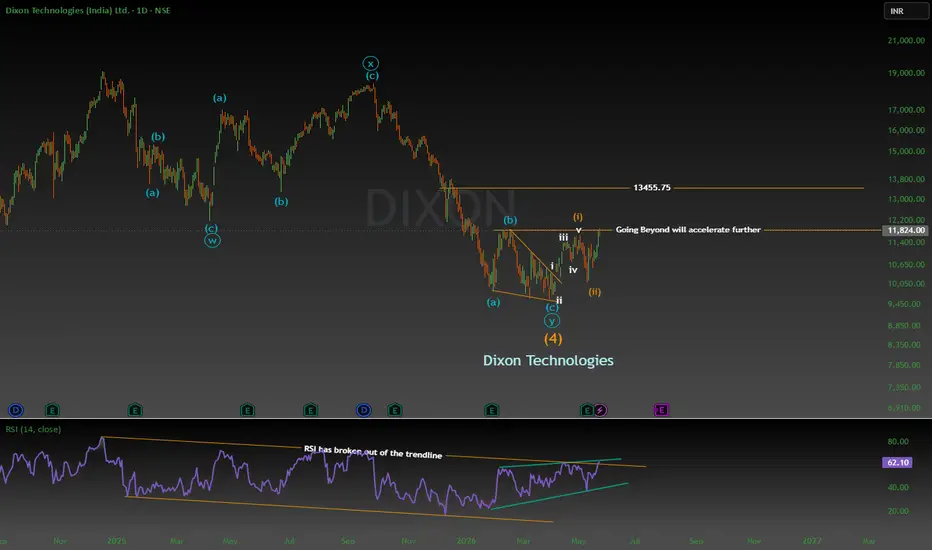
This is a detailed Elliott / Neo Wave styled analysis chart of Dixon Technologies (India) Ltd on the 1-Day time-frame, combining price structure with RSI momentum analysis.
Overall Structure
The chart suggests that Dixon completed a large corrective structure labeled as:
W–X–Y corrective formation
Followed by a possible Wave (4) correction completion
Price now appears to be transitioning into an impulsive bullish advance.
The analyst is tracking an emerging 5-wave impulsive move upward from the recent lows.
Price Action Interpretation
Earlier Corrective Phase
The left side of the chart shows:
Multiple (a)-(b)-(c) corrective swings
A complex corrective combination:
W
X
Y
This indicates:
The stock underwent a prolonged consolidation/correction after previous highs near ₹18k–19k.
The correction appears mature and possibly completed.
Current Bullish Structure
Near the recent bottom around ₹9,600:
The chart labels a completed Wave (4) in orange.
From there, a fresh impulse seems to have started.
The current advance is counted as:
(i) → initial breakout leg
(ii) → pullback
Then developing:
i
ii
iii
iv
possible ongoing (iii)
This nested wave count implies:
The market may be in an early stage of a stronger uptrend.
A breakout above resistance could trigger acceleration.
Key Resistance Levels
Immediate Resistance
Around:
₹11,824
This horizontal orange line is the current breakout trigger zone.
The annotation says:
“Going beyond will accelerate further”
Meaning:
Sustained closing above ₹11,847 could confirm bullish continuation.
Major Resistance
Next important level:
₹13,455.75
This appears to be:
Higher timeframe resistance
Possible target zone after breakout confirmation.
Channel / Wedge Structure
The recent move is drawn inside:
A narrowing bullish wedge/channel.
Interpretation:
Compression before expansion.
Price recently pushed upward from the lower boundary.
Often precedes a momentum breakout.
RSI Analysis
RSI panel at bottom shows:
Bullish RSI Breakout
RSI previously stayed inside a falling channel.
It has now:
Broken above the descending trendline
Formed a rising structure
Current RSI:
Around 62
This supports:
Increasing bullish momentum
Momentum confirmation for the wave count
The analyst explicitly marks:
“RSI has broken out of the trendline”
which strengthens the bullish case.
Technical Conclusion
The chart is signaling:
Bullish Scenario
If price sustains above:
₹11,847
then:
Wave (iii) / (5) expansion may begin
Momentum could accelerate toward:
₹13,455+
and potentially higher later.
Invalidation / Risk Area
If price fails and breaks below:
recent swing lows near ₹10,000–10,200
then:
The impulsive count may weaken.
Current move could instead remain corrective.
This is not a buy/sell reco. Iam not a sebi registered analyst. May consult ur FA before investing/trading.
Overall Structure
The chart suggests that Dixon completed a large corrective structure labeled as:
W–X–Y corrective formation
Followed by a possible Wave (4) correction completion
Price now appears to be transitioning into an impulsive bullish advance.
The analyst is tracking an emerging 5-wave impulsive move upward from the recent lows.
Price Action Interpretation
Earlier Corrective Phase
The left side of the chart shows:
Multiple (a)-(b)-(c) corrective swings
A complex corrective combination:
W
X
Y
This indicates:
The stock underwent a prolonged consolidation/correction after previous highs near ₹18k–19k.
The correction appears mature and possibly completed.
Current Bullish Structure
Near the recent bottom around ₹9,600:
The chart labels a completed Wave (4) in orange.
From there, a fresh impulse seems to have started.
The current advance is counted as:
(i) → initial breakout leg
(ii) → pullback
Then developing:
i
ii
iii
iv
possible ongoing (iii)
This nested wave count implies:
The market may be in an early stage of a stronger uptrend.
A breakout above resistance could trigger acceleration.
Key Resistance Levels
Immediate Resistance
Around:
₹11,824
This horizontal orange line is the current breakout trigger zone.
The annotation says:
“Going beyond will accelerate further”
Meaning:
Sustained closing above ₹11,847 could confirm bullish continuation.
Major Resistance
Next important level:
₹13,455.75
This appears to be:
Higher timeframe resistance
Possible target zone after breakout confirmation.
Channel / Wedge Structure
The recent move is drawn inside:
A narrowing bullish wedge/channel.
Interpretation:
Compression before expansion.
Price recently pushed upward from the lower boundary.
Often precedes a momentum breakout.
RSI Analysis
RSI panel at bottom shows:
Bullish RSI Breakout
RSI previously stayed inside a falling channel.
It has now:
Broken above the descending trendline
Formed a rising structure
Current RSI:
Around 62
This supports:
Increasing bullish momentum
Momentum confirmation for the wave count
The analyst explicitly marks:
“RSI has broken out of the trendline”
which strengthens the bullish case.
Technical Conclusion
The chart is signaling:
Bullish Scenario
If price sustains above:
₹11,847
then:
Wave (iii) / (5) expansion may begin
Momentum could accelerate toward:
₹13,455+
and potentially higher later.
Invalidation / Risk Area
If price fails and breaks below:
recent swing lows near ₹10,000–10,200
then:
The impulsive count may weaken.
Current move could instead remain corrective.
This is not a buy/sell reco. Iam not a sebi registered analyst. May consult ur FA before investing/trading.

Exención de responsabilidad
La información y las publicaciones no constituyen, ni deben considerarse como, asesoramiento o recomendaciones financieras, de inversión, de trading u otro tipo, proporcionadas o respaldadas por TradingView. Obtenga más información en Condiciones de uso.
Exención de responsabilidad
La información y las publicaciones no constituyen, ni deben considerarse como, asesoramiento o recomendaciones financieras, de inversión, de trading u otro tipo, proporcionadas o respaldadas por TradingView. Obtenga más información en Condiciones de uso.