
📊 DMART – STWP Equity Snapshot
Ticker: NSE: DMART
Sector: Retail / Consumer
CMP: 3,934.9 ▲ (+2.89%)
Learning Rating: ⭐⭐⭐⭐☆ (Strength Emerging After Demand Response)
Chart Pattern Observed: Range Base → Early Expansion Attempt
Candlestick Pattern Observed: Strong Bullish Range Expansion Candle
📊 Technical Snapshot
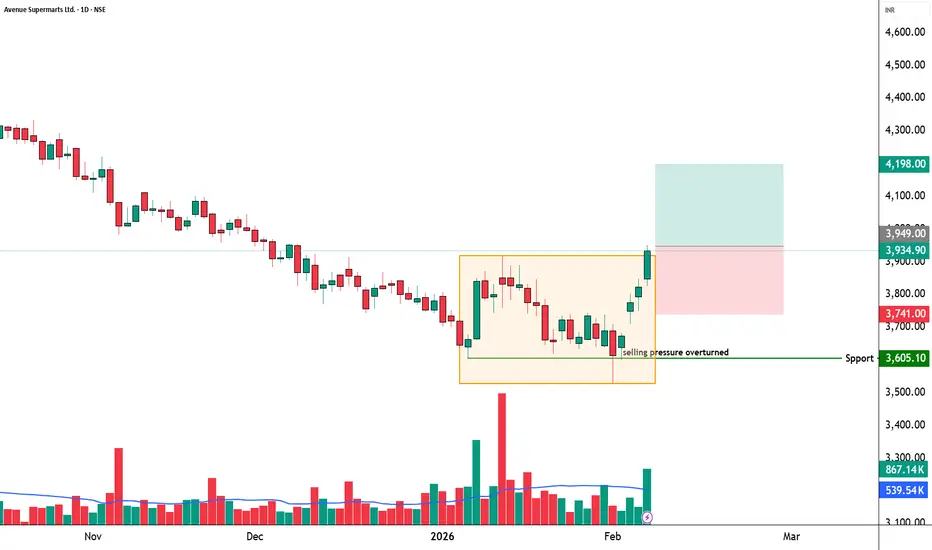
DMART has staged a decisive rebound from a previously defended demand zone, printing a wide-range bullish candle supported by expanding participation. The move reflects active buyer presence after a prolonged balancing phase, suggesting that the market is transitioning from contraction toward expansion.
Price is now approaching the upper boundary of the recent value area, where prior supply reactions have historically emerged. Acceptance above this region would indicate value migration higher, while failure to sustain could lead to temporary rebalancing within the range.
From a CPR perspective, the structure is shifting upward with a projected wide CPR — typically associated with trending environments rather than sideways behaviour. This alignment subtly strengthens the probability of directional continuation, provided participation remains supportive.
Overall structure signals improving momentum, but extension risk must be respected after a sharp single-session expansion.
📊 Volume Analysis
🔹 Current Volume: ~867K
🔹 20-Period Average: ~540K
⚖️ Participation has expanded meaningfully above average, indicating institutional interest rather than purely retail activity.
💡 Interpretation:
Breakouts backed by volume expansion tend to carry better structural reliability than low-participation moves. Sustained volume will be the key validator of whether this is accumulation continuation or merely a short-term price spike.
🔑 Key Levels – Daily Timeframe
Support Areas: 3856 | 3778 | 3732
Resistance Areas: 3981 | 4027 | 4105
These are zones where price has paused or reacted earlier.
What’s Catching Our Eye: Strong demand-led expansion emerging from a defended base.
What to Watch For: Sustained acceptance above the near-term value zone.
Failure Zone: Loss of structure below the immediate support cluster.
Risks to Watch: Post-expansion cooling or short-term profit rotation.
What to Expect Next: Potential continuation attempt with intermittent consolidation.
📌 Price Reference Framework – Educational View
🔹 Intraday Reference (Short-Term Observation)
Observation Zone: 3,949
Risk Invalidation Area: Below 3,741
Upside Reference Zones: 4,198-4,365
Used only to observe near-term price behaviour.
🔹 Swing Reference (Positional | Multi-Session Observation)
Observation Zone: 3,935-3949
Risk Invalidation Area: Below 3,638
Upside Reference Zones: 4,572 → 5,039 (structure projection)
Relevant only if price sustains above the evolving value region.
STWP View
Momentum: Strengthening
Trend: Attempting Upward Transition
Risk: Elevated After Expansion
Volume: Supportive
🧠 Learning Note
Strong candles attract attention — strong structure sustains trends. Always evaluate participation and acceptance before forming directional bias.
⚠️ Disclaimer
This post is shared purely for educational and informational purposes and does not constitute investment advice or a recommendation. Please consult a SEBI-registered financial advisor before making any trading or investment decisions. Market participation involves risk.
💬 Did this help you understand the chart better?
🔼 Boost | ✍️ Comment | 🔁 Share with a learner
👉 Follow STWP for structure-based market education
🚀 Stay Calm. Stay Clean. Trade With Patience.
Ticker: NSE: DMART
Sector: Retail / Consumer
CMP: 3,934.9 ▲ (+2.89%)
Learning Rating: ⭐⭐⭐⭐☆ (Strength Emerging After Demand Response)
Chart Pattern Observed: Range Base → Early Expansion Attempt
Candlestick Pattern Observed: Strong Bullish Range Expansion Candle
📊 Technical Snapshot
DMART has staged a decisive rebound from a previously defended demand zone, printing a wide-range bullish candle supported by expanding participation. The move reflects active buyer presence after a prolonged balancing phase, suggesting that the market is transitioning from contraction toward expansion.
Price is now approaching the upper boundary of the recent value area, where prior supply reactions have historically emerged. Acceptance above this region would indicate value migration higher, while failure to sustain could lead to temporary rebalancing within the range.
From a CPR perspective, the structure is shifting upward with a projected wide CPR — typically associated with trending environments rather than sideways behaviour. This alignment subtly strengthens the probability of directional continuation, provided participation remains supportive.
Overall structure signals improving momentum, but extension risk must be respected after a sharp single-session expansion.
📊 Volume Analysis
🔹 Current Volume: ~867K
🔹 20-Period Average: ~540K
⚖️ Participation has expanded meaningfully above average, indicating institutional interest rather than purely retail activity.
💡 Interpretation:
Breakouts backed by volume expansion tend to carry better structural reliability than low-participation moves. Sustained volume will be the key validator of whether this is accumulation continuation or merely a short-term price spike.
🔑 Key Levels – Daily Timeframe
Support Areas: 3856 | 3778 | 3732
Resistance Areas: 3981 | 4027 | 4105
These are zones where price has paused or reacted earlier.
What’s Catching Our Eye: Strong demand-led expansion emerging from a defended base.
What to Watch For: Sustained acceptance above the near-term value zone.
Failure Zone: Loss of structure below the immediate support cluster.
Risks to Watch: Post-expansion cooling or short-term profit rotation.
What to Expect Next: Potential continuation attempt with intermittent consolidation.
📌 Price Reference Framework – Educational View
🔹 Intraday Reference (Short-Term Observation)
Observation Zone: 3,949
Risk Invalidation Area: Below 3,741
Upside Reference Zones: 4,198-4,365
Used only to observe near-term price behaviour.
🔹 Swing Reference (Positional | Multi-Session Observation)
Observation Zone: 3,935-3949
Risk Invalidation Area: Below 3,638
Upside Reference Zones: 4,572 → 5,039 (structure projection)
Relevant only if price sustains above the evolving value region.
STWP View
Momentum: Strengthening
Trend: Attempting Upward Transition
Risk: Elevated After Expansion
Volume: Supportive
🧠 Learning Note
Strong candles attract attention — strong structure sustains trends. Always evaluate participation and acceptance before forming directional bias.
⚠️ Disclaimer
This post is shared purely for educational and informational purposes and does not constitute investment advice or a recommendation. Please consult a SEBI-registered financial advisor before making any trading or investment decisions. Market participation involves risk.
💬 Did this help you understand the chart better?
🔼 Boost | ✍️ Comment | 🔁 Share with a learner
👉 Follow STWP for structure-based market education
🚀 Stay Calm. Stay Clean. Trade With Patience.
Operación cerrada: precio stop alcanzado

STWP | Mentor & Demand-Supply Specialist |
Empowering traders through structured learning |
simpletradewithpatience.com
wa.me/message/6IOPHGOXMGZ4N1
Educational Only
Empowering traders through structured learning |
simpletradewithpatience.com
wa.me/message/6IOPHGOXMGZ4N1
Educational Only
Exención de responsabilidad
La información y las publicaciones no constituyen, ni deben considerarse como, asesoramiento o recomendaciones financieras, de inversión, de trading u otro tipo, proporcionadas o respaldadas por TradingView. Obtenga más información en Condiciones de uso.
STWP | Mentor & Demand-Supply Specialist |
Empowering traders through structured learning |
simpletradewithpatience.com
wa.me/message/6IOPHGOXMGZ4N1
Educational Only
Empowering traders through structured learning |
simpletradewithpatience.com
wa.me/message/6IOPHGOXMGZ4N1
Educational Only
Exención de responsabilidad
La información y las publicaciones no constituyen, ni deben considerarse como, asesoramiento o recomendaciones financieras, de inversión, de trading u otro tipo, proporcionadas o respaldadas por TradingView. Obtenga más información en Condiciones de uso.