 DOID
DOID has been one of the favorite second-liner stocks in the IDX.
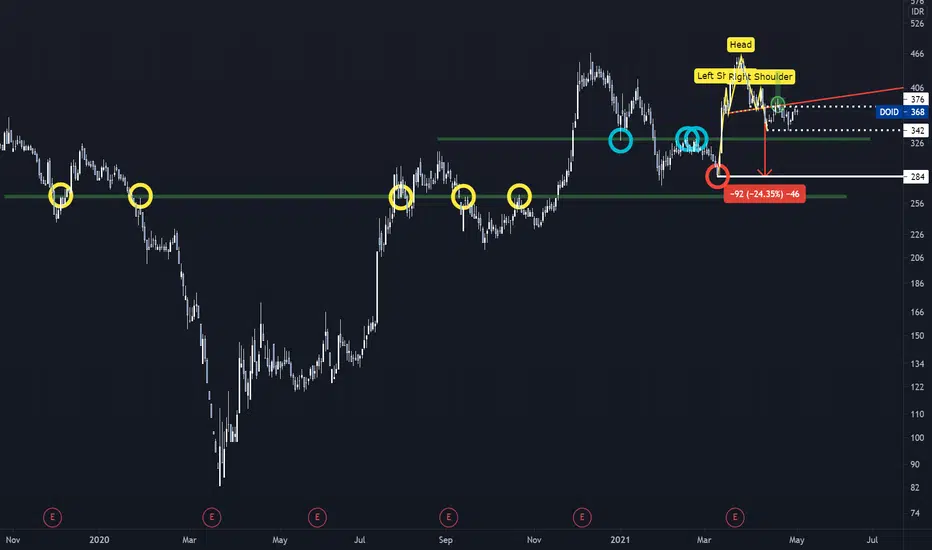
In the past, the 260-264 (yellow circle) area has been the target for this stock.
DOID reached the highest price of 466 on 08 December 2020. Since then, 328-332 is the important Support-Resist area (high area) for DOID.
DOID formed a Double Bottom pattern between 29 January to 09 March 2021, and the target has been achieved on 12 March 2021.
Price continuously building an uptrend momentum with the highest price at 460 (Extension 3.618 from the last small swing low) and forming a Head and Shoulder pattern with the red ray as the neckline.
The Neckline has been tested with Three Candles (19-21 April) and is currently forming sideways between 342-376.
The head and shoulder pattern target will be at 284 (last low of Double Bottom Pattern).
Disclaimer is always on.
Trade at your own risks.
Nota
The Neck line is still holding on.
Exención de responsabilidad
La información y las publicaciones no constituyen, ni deben considerarse como, asesoramiento o recomendaciones financieras, de inversión, de trading u otro tipo, proporcionadas o respaldadas por TradingView. Obtenga más información en Condiciones de uso.
Exención de responsabilidad
La información y las publicaciones no constituyen, ni deben considerarse como, asesoramiento o recomendaciones financieras, de inversión, de trading u otro tipo, proporcionadas o respaldadas por TradingView. Obtenga más información en Condiciones de uso.