
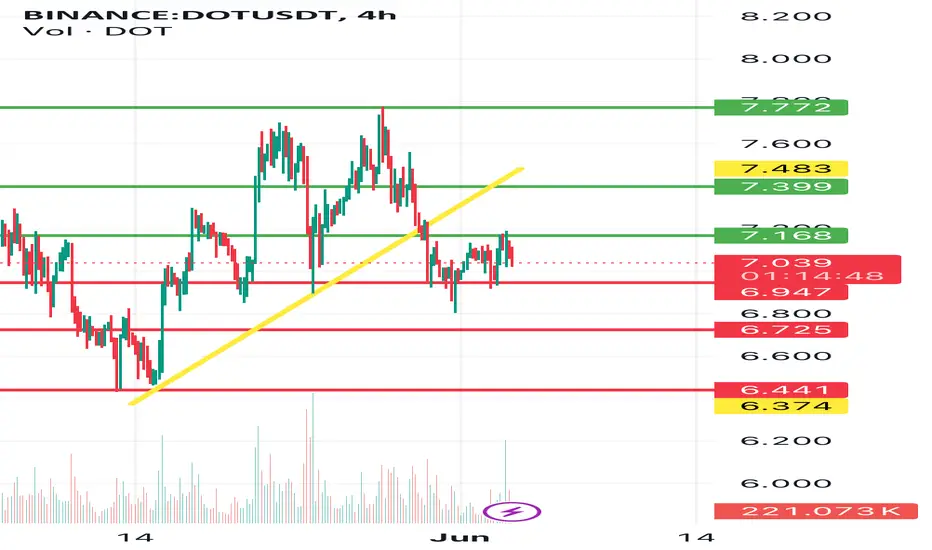
Hello everyone, welcome to a quick review of the DOT chart. As we can see on the chart, we are locally moving along a downward trend line. After unfolding the fib retracement grid, you can see the price staying above the strong support level at $7.04, then the support level at $6.73, and then the strong support level at $6.44. Looking the other way, you can similarly identify resistance points. And here we can see the resistance at the level of $7.17, the next important place is $7.40, after which we will be able to see an upward movement towards the resistance at the price of $7.77.

Exención de responsabilidad
La información y las publicaciones no constituyen, ni deben considerarse como, asesoramiento o recomendaciones financieras, de inversión, de trading u otro tipo, proporcionadas o respaldadas por TradingView. Obtenga más información en Condiciones de uso.
Exención de responsabilidad
La información y las publicaciones no constituyen, ni deben considerarse como, asesoramiento o recomendaciones financieras, de inversión, de trading u otro tipo, proporcionadas o respaldadas por TradingView. Obtenga más información en Condiciones de uso.