
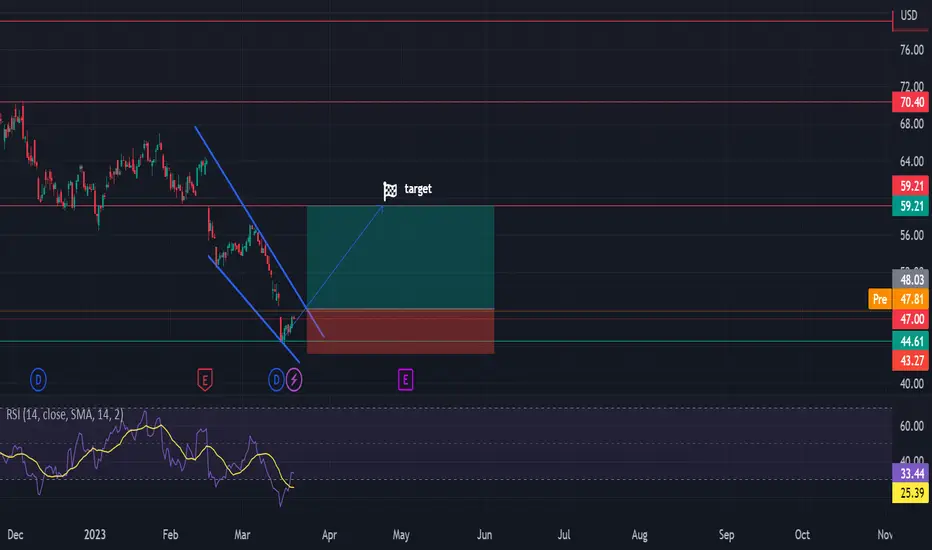
Devon Energy Corporation is on a descending triangle, so we expect a retracement of the price. Moreover the price is hitting both the support and the band of the triangle, making the price more likely to raise, Also the RSI index shows that the stocks are oversold, further strengthen this theory. You can go long on this stock as soon as its price breaks the upper band of the triangle. You can then sell in the resistance as shown in the chart.
Operación activa
breakoutNota
Good progress so far
💥 Free signals and ideas ➡ t.me/vfinvestment
Publicaciones relacionadas
Exención de responsabilidad
La información y las publicaciones no constituyen, ni deben considerarse como, asesoramiento o recomendaciones financieras, de inversión, de trading u otro tipo, proporcionadas o respaldadas por TradingView. Obtenga más información en Condiciones de uso.
💥 Free signals and ideas ➡ t.me/vfinvestment
Publicaciones relacionadas
Exención de responsabilidad
La información y las publicaciones no constituyen, ni deben considerarse como, asesoramiento o recomendaciones financieras, de inversión, de trading u otro tipo, proporcionadas o respaldadas por TradingView. Obtenga más información en Condiciones de uso.