
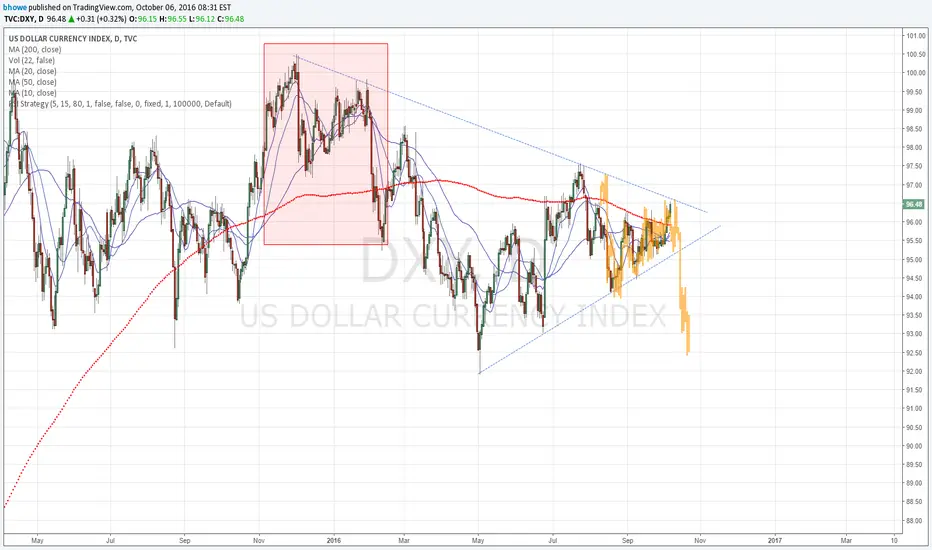
US Dollar looks to be recreating the pattern that started this pennant. See the candle pattern from the red box and overlay it currently in gold. This could be how it plays out. Everything fits. Get ready to go GOLD
Nota
Although we have a break above the trend line, and positive divergence in the TSI, I feel the cycles support a drop in the USD. I see the RSI and %R both way overbought. Its time for the US Dollar to drop. I see this a technical shake out. Nota
The USD cycle is getting over extended, at 40 days, thats longer than normal. The RSI and %R are both overbought. I expect a drop any day. Nota
US Dollar at the 1.27% FIBO point and the upper trend channel line. 47 days into the cycle, its due to plunge here. Nota
Measured move to the 1.27% Fibo was spot on. Now looking for the golden candle pattern to fill. Nota
USD playing out perfectly. Oversold right now, so we may get a bounce, but will eventually fall further. Nota
Dollar could be forming a Bullish Bat harmonic pattern. Can't happen soon enough
Exención de responsabilidad
La información y las publicaciones no constituyen, ni deben considerarse como, asesoramiento o recomendaciones financieras, de inversión, de trading u otro tipo, proporcionadas o respaldadas por TradingView. Obtenga más información en Condiciones de uso.
Exención de responsabilidad
La información y las publicaciones no constituyen, ni deben considerarse como, asesoramiento o recomendaciones financieras, de inversión, de trading u otro tipo, proporcionadas o respaldadas por TradingView. Obtenga más información en Condiciones de uso.