Largo
EOS USDT
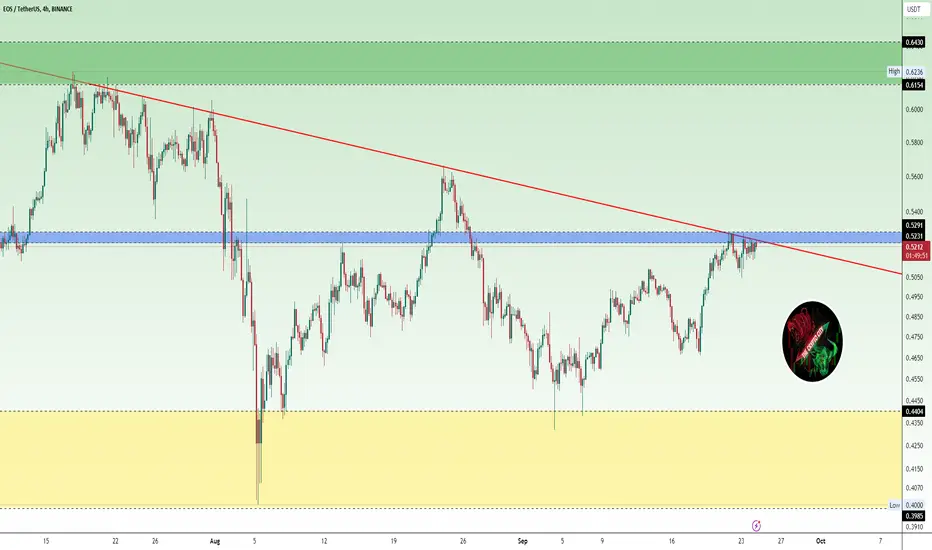
The EOS/USDT chart shows the price testing a crucial resistance zone (Blue) at $0.5231 - $0.5291, the price is consolidating under this resistance zone (Blue). A red descending trendline indicates downward resistance, which makes the price challenging. A successful breakout above the resistance zone (Blue) and the descending trend line could trigger a strong bullish wave. Failure to break this level may lead to further consolidation or downward movement.
Everything is on the chart
Everything is on the chart

Exención de responsabilidad
La información y las publicaciones no constituyen, ni deben considerarse como, asesoramiento o recomendaciones financieras, de inversión, de trading u otro tipo, proporcionadas o respaldadas por TradingView. Obtenga más información en Condiciones de uso.
Exención de responsabilidad
La información y las publicaciones no constituyen, ni deben considerarse como, asesoramiento o recomendaciones financieras, de inversión, de trading u otro tipo, proporcionadas o respaldadas por TradingView. Obtenga más información en Condiciones de uso.