
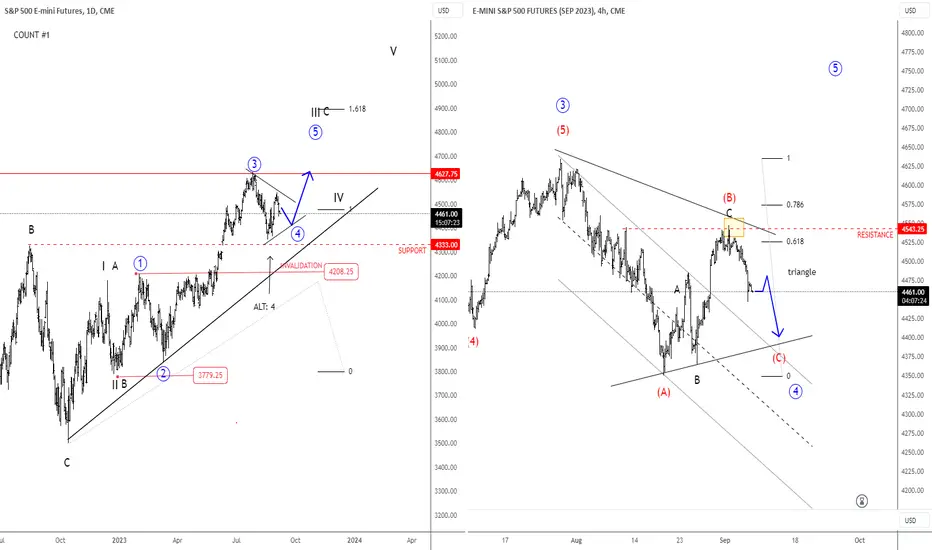
SP500 has been bullish most of the year; a trend that can resume after a corrective pullback that is underway now, seen in wave 4 on a daily chart. However, wave 4 should then be made by three waves before correction can come to an end; which is not the case yet, as the recent bounce to 4492-4543 resistance area looks like a corrective wave, ideally wave (B), so be aware of more weakness after recent turn down. Ideally, wave (C) of 4 is now underway towards the lower side of a summer range. If wave (A) low is not going to be broken then wave four can also become a triangle rather than deep A-B-C drop.

Join the community for one week, full access. Its free >> @ wavetraders.com/elliott-wave-plans/
Learn Elliott Waves Sale-65%
👉 wavetraders.com/academy/
Newsletter
👉 bit.ly/3FVPVzO
Learn Elliott Waves Sale-65%
👉 wavetraders.com/academy/
Newsletter
👉 bit.ly/3FVPVzO
Publicaciones relacionadas
Exención de responsabilidad
La información y las publicaciones no constituyen, ni deben considerarse como, asesoramiento o recomendaciones financieras, de inversión, de trading u otro tipo, proporcionadas o respaldadas por TradingView. Obtenga más información en Condiciones de uso.
Join the community for one week, full access. Its free >> @ wavetraders.com/elliott-wave-plans/
Learn Elliott Waves Sale-65%
👉 wavetraders.com/academy/
Newsletter
👉 bit.ly/3FVPVzO
Learn Elliott Waves Sale-65%
👉 wavetraders.com/academy/
Newsletter
👉 bit.ly/3FVPVzO
Publicaciones relacionadas
Exención de responsabilidad
La información y las publicaciones no constituyen, ni deben considerarse como, asesoramiento o recomendaciones financieras, de inversión, de trading u otro tipo, proporcionadas o respaldadas por TradingView. Obtenga más información en Condiciones de uso.