
etc story is bit intresting
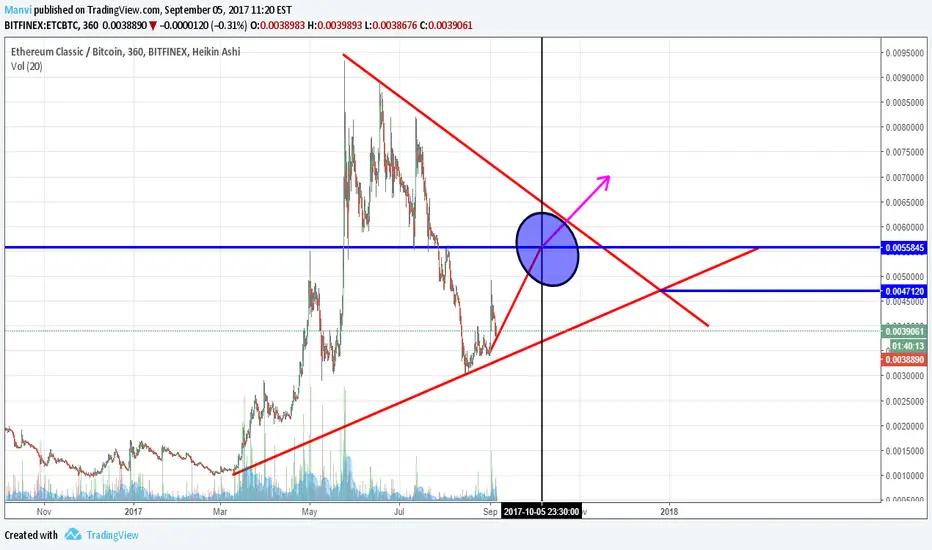
so lets try to undersatnd wht is happenning out here so take a look at chart
etc price in jan,17 = 0.00125-0.00150
etc went in may,17 = 0.00675-0.00912
then again a dip in july,17 = 0.00315-0.00335
now again will go up in 5th oct,17 = 0.00565-0.00595
then etc can pump a big upto 0.012 otherwise next dump will bring etc down to 0.00491 level like (july,17)
and then again same pattern
so lets try to undersatnd wht is happenning out here so take a look at chart
etc price in jan,17 = 0.00125-0.00150
etc went in may,17 = 0.00675-0.00912
then again a dip in july,17 = 0.00315-0.00335
now again will go up in 5th oct,17 = 0.00565-0.00595
then etc can pump a big upto 0.012 otherwise next dump will bring etc down to 0.00491 level like (july,17)
and then again same pattern

Exención de responsabilidad
La información y las publicaciones no constituyen, ni deben considerarse como, asesoramiento o recomendaciones financieras, de inversión, de trading u otro tipo, proporcionadas o respaldadas por TradingView. Obtenga más información en Condiciones de uso.
Exención de responsabilidad
La información y las publicaciones no constituyen, ni deben considerarse como, asesoramiento o recomendaciones financieras, de inversión, de trading u otro tipo, proporcionadas o respaldadas por TradingView. Obtenga más información en Condiciones de uso.