
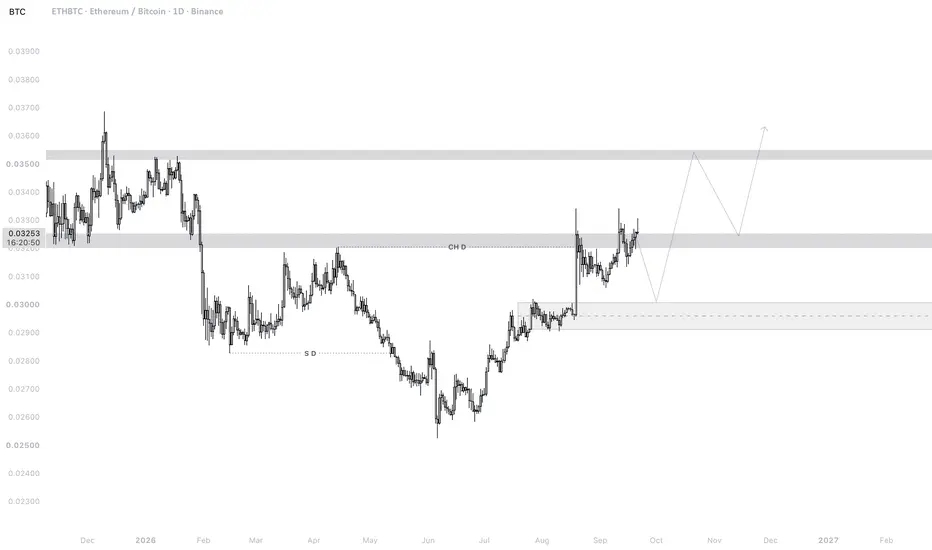
ETHBTC is currently showing a significant structural recovery on the daily timeframe after a prolonged bearish phase that pushed price from the 0.035–0.036 resistance region into the major demand zone around 0.025–0.026.
The market previously formed a clear sequence of lower highs and lower lows, but the recent reaction from the lows has created a potential Change of Character (CHD), with ETHBTC reclaiming the 0.0315–0.0325 structural area and shifting short-term momentum back toward buyers.
The recent impulsive move from the 0.02578 low indicates strong demand absorption, followed by a consolidation phase below the major resistance zone. Current price action appears to be a controlled retest rather than a confirmed rejection, as ETHBTC continues to hold above the reclaimed structure.
Price is currently trading around the key resistance zone of 0.0325–0.0330, which aligns with:
• Previous breakdown area (support → resistance flip)
• CHD confirmation level
• Current consolidation resistance
• Liquidity resting above recent highs
• Path toward higher timeframe supply zone
This area represents the main decision point for the next expansion move.
Primary Scenario – Bullish Continuation
• Daily acceptance above 0.0325–0.0330
• Successful retest of the breakout area
• Continued ETH relative strength against BTC
Upside targets:
• 0.0350–0.0355 (Major Resistance Zone)
• 0.0365–0.0370
• Extension toward higher liquidity if momentum continues
A clean breakout above 0.0330 would confirm the structural recovery and could open the path toward the upper supply zone around 0.0355–0.0360.
Alternative Scenario – Bearish Rejection
• Failure to hold above 0.0325 resistance
• Rejection from the current consolidation top
• Loss of the breakout base around 0.0300
Downside targets:
• 0.0295–0.0300 (Demand / Retest Zone)
• 0.0275–0.0280 (Previous Accumulation Area)
• 0.0257 (Major Swing Low Liquidity)
A move below the lower demand structure would weaken the current recovery and suggest another liquidity sweep before a new attempt higher.
Key Levels
Immediate Resistance:
🔴 0.0325 – 0.0330
Major Supply Zone:
🔴 0.0350 – 0.0355
Higher Resistance:
🔴 0.0365 – 0.0370
CHD / Structural Pivot:
🟡 0.0315 – 0.0320
Key Demand Zone:
🟢 0.0295 – 0.0300
Major Demand:
🟢 0.0275 – 0.0280
Liquidity Low:
🟢 0.0257
Until ETHBTC loses the 0.0295–0.0300 demand zone, the daily structure remains constructive and the current consolidation can be viewed as a potential continuation setup.
Bias: Bullish above 0.0300
Key Decision Zone: 0.0325–0.0330
Bullish Confirmation: Acceptance above 0.0330
Upside Targets: 0.0355 → 0.0365
Bearish Invalidation: Sustained acceptance below 0.0295

Exención de responsabilidad
La información y las publicaciones no constituyen, ni deben considerarse como, asesoramiento o recomendaciones financieras, de inversión, de trading u otro tipo, proporcionadas o respaldadas por TradingView. Obtenga más información en Condiciones de uso.
Exención de responsabilidad
La información y las publicaciones no constituyen, ni deben considerarse como, asesoramiento o recomendaciones financieras, de inversión, de trading u otro tipo, proporcionadas o respaldadas por TradingView. Obtenga más información en Condiciones de uso.