
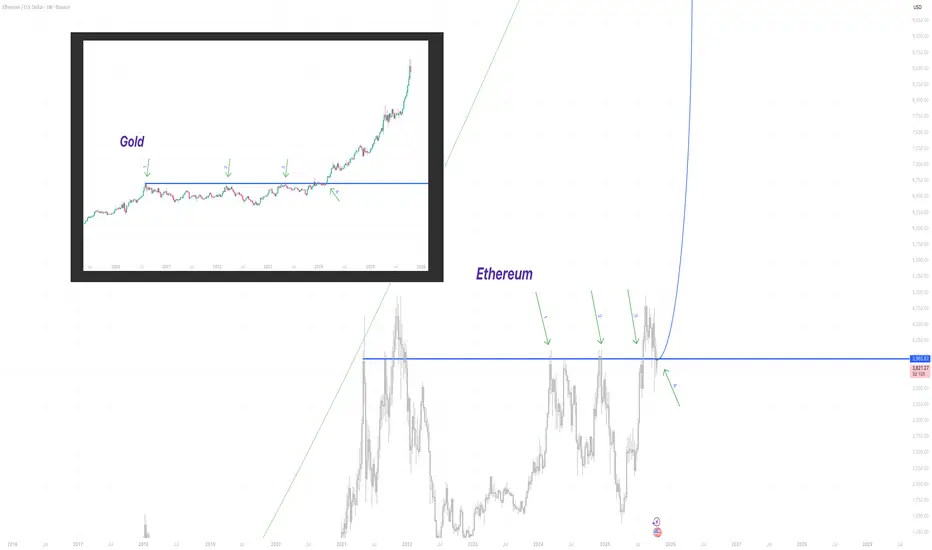
Let’s take a look at the charts. Gold formed a triple top before breaking out strongly, and the current Ethereum structure looks strikingly similar, only moving much faster.
The gold chart you see here developed over 15 years, while Ethereum’s pattern has taken shape in just 4 years.
When a resistance level is tested multiple times, it often eventually breaks.
I’m sharing this analysis to help you recognize recurring patterns across markets. History doesn’t repeat itself perfectly, but it often rhymes.
The gold chart you see here developed over 15 years, while Ethereum’s pattern has taken shape in just 4 years.
When a resistance level is tested multiple times, it often eventually breaks.
I’m sharing this analysis to help you recognize recurring patterns across markets. History doesn’t repeat itself perfectly, but it often rhymes.

Exención de responsabilidad
La información y las publicaciones no constituyen, ni deben considerarse como, asesoramiento o recomendaciones financieras, de inversión, de trading u otro tipo, proporcionadas o respaldadas por TradingView. Obtenga más información en Condiciones de uso.
Exención de responsabilidad
La información y las publicaciones no constituyen, ni deben considerarse como, asesoramiento o recomendaciones financieras, de inversión, de trading u otro tipo, proporcionadas o respaldadas por TradingView. Obtenga más información en Condiciones de uso.