
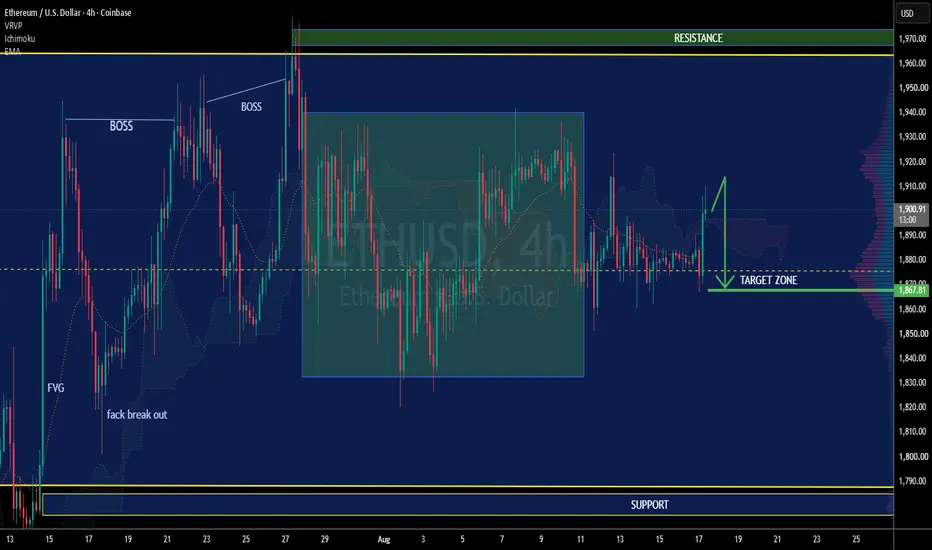
This is the Ethereum / U.S. Dollar - ETHUSD 4-Hour chart on Coinbase from TradingView.
Chart Analysis:
1. Volatility: ETH made big moves earlier with a "fake break out" and FVG marked on the left. Also showed "BOSS" Break Of Structure twice.
2. Consolidation: After the spike, price entered a wide sideways box/range in the middle of the chart.
3. Current Setup: ETH is now trading ∼$1,900. The chart shows a pullback expected to the TARGET ZONE around $1,867 before buyers step in. Green arrow shows potential bounce from there.
4. Structure: Top is marked RESISTANCE and bottom is marked SUPPORT. Price is between them.
Key Levels to Watch:
- Support: $1,790 - $1,800 - Yellow zone at bottom. Major demand area
- Target Zone / Buy Area: $1,867 - Where the arrow is pointing for a potential long
- Resistance: ∼$1,940 - $1,950 - Top of the recent range. Break opens move to $2,000+
Bias: Neutral to Bullish. As long as ETH holds above $1,800 support, dips to $1,867 look like buy opportunities. A 4H close below $1,790 flips bias bearish.
Educational only. Not financial advice.
Operación activa
active 
t.me/+iZwBzq15KTM1Mzc0
join telegram for free signal on gold and different markets
t.me/+iZwBzq15KTM1Mzc0
join free telegram channel
join telegram for free signal on gold and different markets
t.me/+iZwBzq15KTM1Mzc0
join free telegram channel
Exención de responsabilidad
La información y las publicaciones no constituyen, ni deben considerarse como, asesoramiento o recomendaciones financieras, de inversión, de trading u otro tipo, proporcionadas o respaldadas por TradingView. Obtenga más información en Condiciones de uso.
t.me/+iZwBzq15KTM1Mzc0
join telegram for free signal on gold and different markets
t.me/+iZwBzq15KTM1Mzc0
join free telegram channel
join telegram for free signal on gold and different markets
t.me/+iZwBzq15KTM1Mzc0
join free telegram channel
Exención de responsabilidad
La información y las publicaciones no constituyen, ni deben considerarse como, asesoramiento o recomendaciones financieras, de inversión, de trading u otro tipo, proporcionadas o respaldadas por TradingView. Obtenga más información en Condiciones de uso.