
Macro
The macro backdrop remains restrictive for high-beta risk assets. Real yields remain firm and liquidity conditions are not in expansion mode. Institutional capital allocation across digital assets continues to favor defensive positioning, with rallies being sold rather than accumulated. In the absence of a macro liquidity catalyst, continuation flows dominate over reversal structures.
Liquidity Framework
EMA 50 Structure:
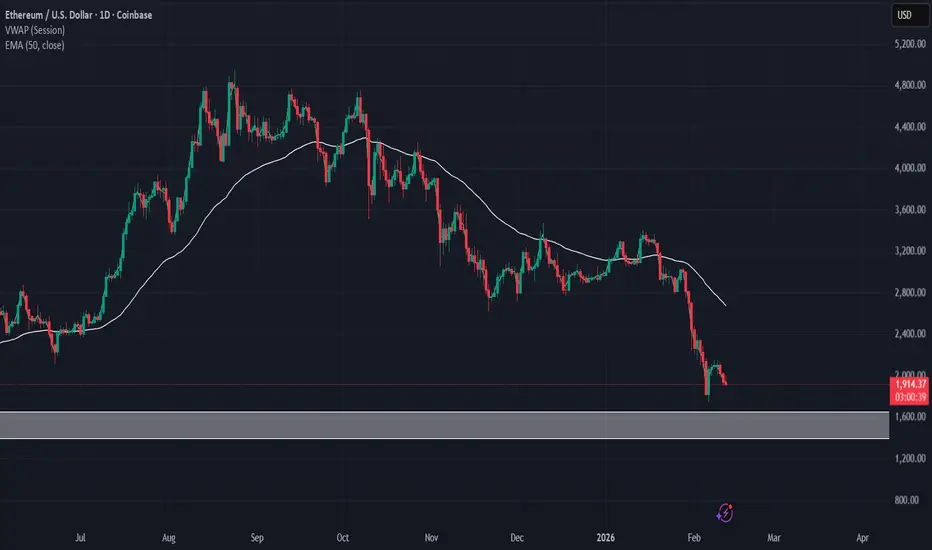
The white line represents the 50 EMA. Price is trading decisively below it, and the EMA is sloping downward. This confirms bearish structure and active trend continuation conditions. The EMA is currently positioned near 2,100 and acts as dynamic supply.
VWAP Positioning:
All VWAP levels remain above current price, confirming institutional distribution. Price trading below both EMA 50 and VWAP cluster reinforces sell-side control.
Liquidity Pools:
Buy-side liquidity resting above 2,120 (EMA reclaim zone).
Secondary liquidity pool above 2,400 (prior breakdown acceleration).
Immediate sell-side liquidity below 1,850.
Major weekly demand resting between 1,500–1,650.
Volume Confirmation:
Bearish expansion legs show increased participation. Counter-trend rallies display contracting volume, indicating corrective nature rather than accumulation.
Intraday Bias (HTF Driven):
Bearish bias remains valid while price trades below 2,120 and below the EMA 50 (white line).
Key Levels:
Dynamic Resistance (EMA 50): ~2,100
Structural Resistance: 2,120
Support: 1,850
Weekly Demand: 1,500–1,650
Execution Blueprint
Direction: Short
Entry: 2,065
Stop Loss: 2,230
Take Profit: 1,735
BIG THANKS COMMUNITY ❤️
The macro backdrop remains restrictive for high-beta risk assets. Real yields remain firm and liquidity conditions are not in expansion mode. Institutional capital allocation across digital assets continues to favor defensive positioning, with rallies being sold rather than accumulated. In the absence of a macro liquidity catalyst, continuation flows dominate over reversal structures.
Liquidity Framework
EMA 50 Structure:
The white line represents the 50 EMA. Price is trading decisively below it, and the EMA is sloping downward. This confirms bearish structure and active trend continuation conditions. The EMA is currently positioned near 2,100 and acts as dynamic supply.
VWAP Positioning:
All VWAP levels remain above current price, confirming institutional distribution. Price trading below both EMA 50 and VWAP cluster reinforces sell-side control.
Liquidity Pools:
Buy-side liquidity resting above 2,120 (EMA reclaim zone).
Secondary liquidity pool above 2,400 (prior breakdown acceleration).
Immediate sell-side liquidity below 1,850.
Major weekly demand resting between 1,500–1,650.
Volume Confirmation:
Bearish expansion legs show increased participation. Counter-trend rallies display contracting volume, indicating corrective nature rather than accumulation.
Intraday Bias (HTF Driven):
Bearish bias remains valid while price trades below 2,120 and below the EMA 50 (white line).
Key Levels:
Dynamic Resistance (EMA 50): ~2,100
Structural Resistance: 2,120
Support: 1,850
Weekly Demand: 1,500–1,650
Execution Blueprint
Direction: Short
Entry: 2,065
Stop Loss: 2,230
Take Profit: 1,735
BIG THANKS COMMUNITY ❤️

Exención de responsabilidad
La información y las publicaciones no constituyen, ni deben considerarse como, asesoramiento o recomendaciones financieras, de inversión, de trading u otro tipo, proporcionadas o respaldadas por TradingView. Obtenga más información en Condiciones de uso.
Exención de responsabilidad
La información y las publicaciones no constituyen, ni deben considerarse como, asesoramiento o recomendaciones financieras, de inversión, de trading u otro tipo, proporcionadas o respaldadas por TradingView. Obtenga más información en Condiciones de uso.