
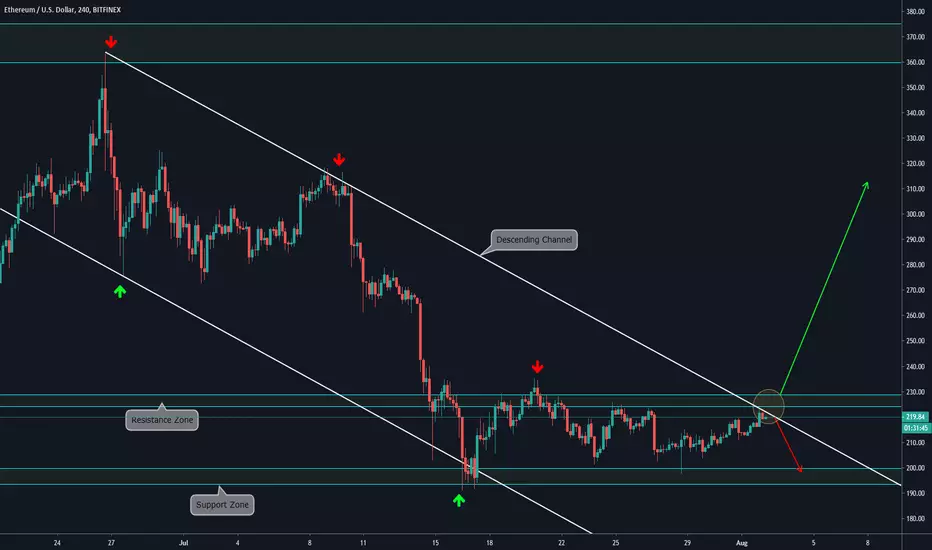
4H CHART EXPLANATION:
We observe that Ethereum has been moving sideways for a few days, and now it is facing the Descending Trendline and the Resistance Zone. If this zone is broke, we expect a bullish movement towards the next Resistance Zone. And, in case this zone can hold the price, it may bounce and retest the Support Zone again. Major movements are explained on the higher timeframes below.
MULTI TIMEFRAME ANALYSIS:
-Daily:

-Weekly:

We observe that Ethereum has been moving sideways for a few days, and now it is facing the Descending Trendline and the Resistance Zone. If this zone is broke, we expect a bullish movement towards the next Resistance Zone. And, in case this zone can hold the price, it may bounce and retest the Support Zone again. Major movements are explained on the higher timeframes below.
MULTI TIMEFRAME ANALYSIS:
-Daily:
-Weekly:

Exención de responsabilidad
La información y las publicaciones no constituyen, ni deben considerarse como, asesoramiento o recomendaciones financieras, de inversión, de trading u otro tipo, proporcionadas o respaldadas por TradingView. Obtenga más información en Condiciones de uso.
Exención de responsabilidad
La información y las publicaciones no constituyen, ni deben considerarse como, asesoramiento o recomendaciones financieras, de inversión, de trading u otro tipo, proporcionadas o respaldadas por TradingView. Obtenga más información en Condiciones de uso.