
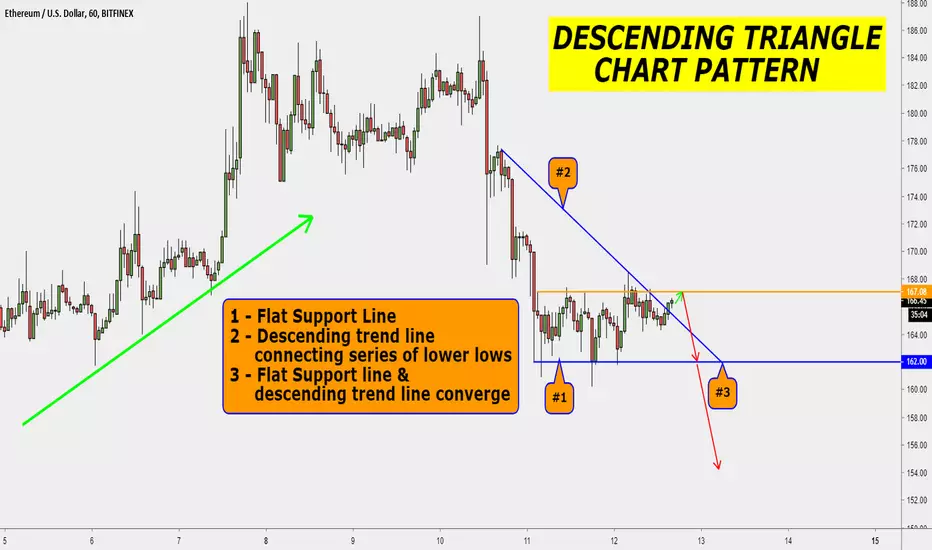
The descending triangle pattern is a continuation chart pattern that develops in the middle of a downtrend. However, in some instances this can play as a descending triangle reversal, also known as the bullish descending triangle pattern.
Note: The more a support level is tested the weaker it becomes.
Additionally, the breakout candle must also produce a close below the flat support level for a valid trade setup.
Note: The more a support level is tested the weaker it becomes.
Additionally, the breakout candle must also produce a close below the flat support level for a valid trade setup.

Exención de responsabilidad
La información y las publicaciones no constituyen, ni deben considerarse como, asesoramiento o recomendaciones financieras, de inversión, de trading u otro tipo, proporcionadas o respaldadas por TradingView. Obtenga más información en Condiciones de uso.
Exención de responsabilidad
La información y las publicaciones no constituyen, ni deben considerarse como, asesoramiento o recomendaciones financieras, de inversión, de trading u otro tipo, proporcionadas o respaldadas por TradingView. Obtenga más información en Condiciones de uso.