
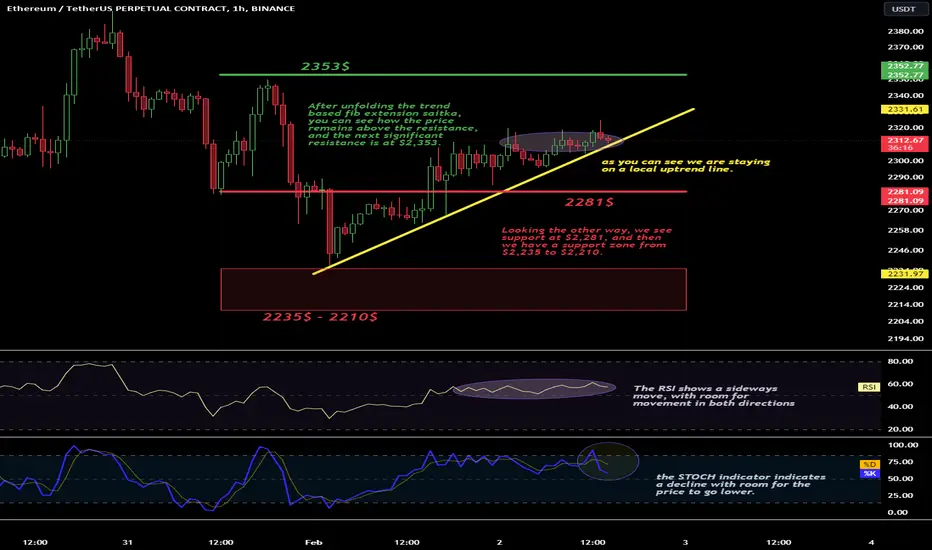
Hello everyone, let's look at the ETH to USDT chart on an hourly basis, as you can see we are staying on a local uptrend line.
After unfolding the trend based fib extension saitka, you can see how the price remains above the resistance, and the next significant resistance is at $2,353.
Looking the other way, we see support at $2,281, and then we have a support zone from $2,235 to $2,210.
The RSI shows a sideways move, with room for movement in both directions, while the STOCH indicator indicates a decline with room for the price to go lower.

Exención de responsabilidad
La información y las publicaciones no constituyen, ni deben considerarse como, asesoramiento o recomendaciones financieras, de inversión, de trading u otro tipo, proporcionadas o respaldadas por TradingView. Obtenga más información en Condiciones de uso.
Exención de responsabilidad
La información y las publicaciones no constituyen, ni deben considerarse como, asesoramiento o recomendaciones financieras, de inversión, de trading u otro tipo, proporcionadas o respaldadas por TradingView. Obtenga más información en Condiciones de uso.