
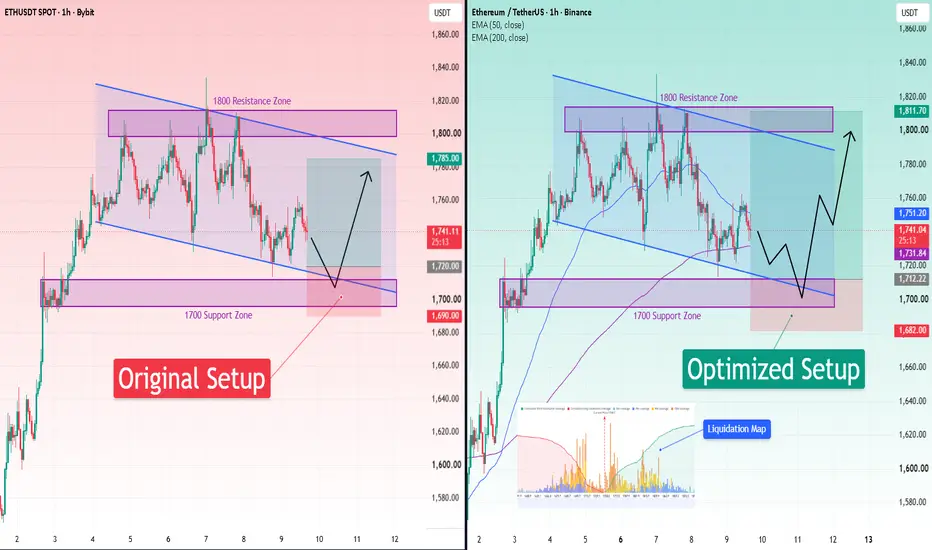
Today I am analyzing an ETH long setup from the 1,700 support zone. The raw thesis uses a 1,720 entry, a 1,785 take-profit, and a 1,690 stop-loss. My objective is to optimize these exact levels using a liquidation map and EMA data.
💡 IDEA
The original idea relied on vague support zones, taking a long position from 1,700 to below 1,800.
This ignores trapped market liquidity. The optimized thesis utilizes a massive 384.86M support liquidation cluster for entry, targeting the short liquidation cluster overhead.
🛫 ENTRY
The original entry at 1,720 sits right at the top edge of the support cluster.
Leaving the trade highly susceptible to being swept, it rests precariously below the recent swing low. The entry was moved down to 1,713 to sweep the major swing low and tap the exact core of the support cluster.
This setup is invalidated if price reaches 1,803.3 first, as the primary magnetic fuel would be spent.
💰 TAKE-PROFIT
The original take-profit of 1,785 exits the trade prematurely inside a weaker zone.
This completely misses the most concentrated pool of liquidity. In a neutrally biased market, price is naturally drawn to peak liquidation nodes.
The take-profit was adjusted to 1,811.7, aligning with the core of the heaviest resistance liquidation cluster to exit into forced buying pressure.
🛡️ STOP-LOSS
The original stop-loss at 1,690 is prime stop-hunt liquidity.
It rests directly above the 7-day major swing low and deep inside the broader liquidation cluster.
The stop-loss was shifted down to 1,682. This tucks it safely beneath the major swing low to protect from structural wicks, fully invalidating the trade if breached.
⚖️ RISK-TO-REWARD
The entry and stop-loss were shifted lower in tandem, maintaining nearly the exact same risk per unit.
Extending the target to the peak of the upside liquidity cluster drastically increases profit potential. The ratio improves from 1:2.16 to 1:3.18, maximizing return while minimizing stop-hunts.
It will be interesting to see which setup actually performs better.
💡 IDEA
The original idea relied on vague support zones, taking a long position from 1,700 to below 1,800.
This ignores trapped market liquidity. The optimized thesis utilizes a massive 384.86M support liquidation cluster for entry, targeting the short liquidation cluster overhead.
🛫 ENTRY
The original entry at 1,720 sits right at the top edge of the support cluster.
Leaving the trade highly susceptible to being swept, it rests precariously below the recent swing low. The entry was moved down to 1,713 to sweep the major swing low and tap the exact core of the support cluster.
This setup is invalidated if price reaches 1,803.3 first, as the primary magnetic fuel would be spent.
💰 TAKE-PROFIT
The original take-profit of 1,785 exits the trade prematurely inside a weaker zone.
This completely misses the most concentrated pool of liquidity. In a neutrally biased market, price is naturally drawn to peak liquidation nodes.
The take-profit was adjusted to 1,811.7, aligning with the core of the heaviest resistance liquidation cluster to exit into forced buying pressure.
🛡️ STOP-LOSS
The original stop-loss at 1,690 is prime stop-hunt liquidity.
It rests directly above the 7-day major swing low and deep inside the broader liquidation cluster.
The stop-loss was shifted down to 1,682. This tucks it safely beneath the major swing low to protect from structural wicks, fully invalidating the trade if breached.
⚖️ RISK-TO-REWARD
The entry and stop-loss were shifted lower in tandem, maintaining nearly the exact same risk per unit.
Extending the target to the peak of the upside liquidity cluster drastically increases profit potential. The ratio improves from 1:2.16 to 1:3.18, maximizing return while minimizing stop-hunts.
It will be interesting to see which setup actually performs better.
Orden cancelada
All trades cancelled. Waiting for the next setup.
Exención de responsabilidad
La información y las publicaciones no constituyen, ni deben considerarse como, asesoramiento o recomendaciones financieras, de inversión, de trading u otro tipo, proporcionadas o respaldadas por TradingView. Obtenga más información en Condiciones de uso.
Exención de responsabilidad
La información y las publicaciones no constituyen, ni deben considerarse como, asesoramiento o recomendaciones financieras, de inversión, de trading u otro tipo, proporcionadas o respaldadas por TradingView. Obtenga más información en Condiciones de uso.