Corto
ETP/USD DAILY CHART bearish signals
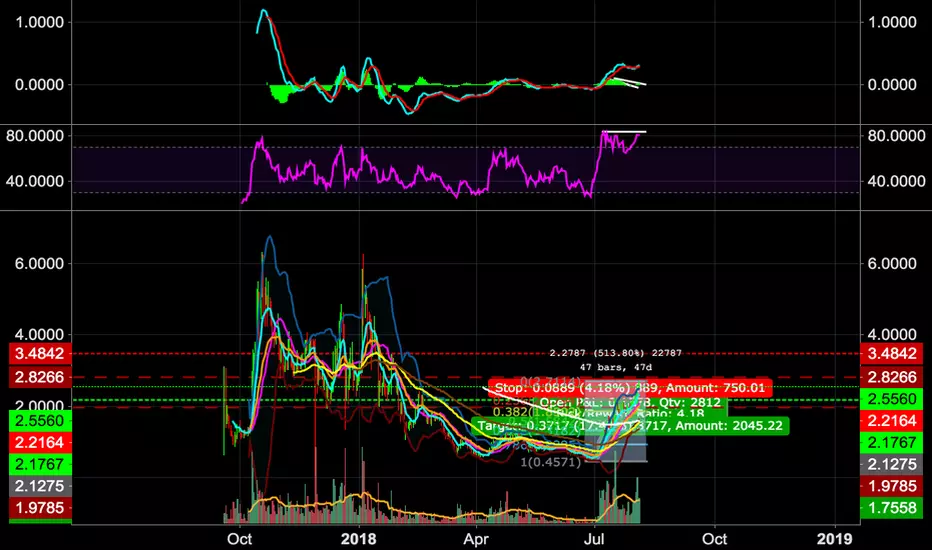
after an increase in price of more than 513% in 41 days with high volume ETP is most likely to retrace very soon.
MACD is really high and forms bearish divergences in the histogram. In addition RSI is performing bearish divergences too and is in the overbought zone for quite a long time.
Strong bearish signals. Daily chart. Nevertheless I see a possible rise to 2.833 USD before the retracement starts as the is the 6.18 fib level.
MACD is really high and forms bearish divergences in the histogram. In addition RSI is performing bearish divergences too and is in the overbought zone for quite a long time.
Strong bearish signals. Daily chart. Nevertheless I see a possible rise to 2.833 USD before the retracement starts as the is the 6.18 fib level.
Nota
as there is the 6.18 fib level.*
Exención de responsabilidad
La información y las publicaciones no constituyen, ni deben considerarse como, asesoramiento o recomendaciones financieras, de inversión, de trading u otro tipo, proporcionadas o respaldadas por TradingView. Obtenga más información en Condiciones de uso.
Exención de responsabilidad
La información y las publicaciones no constituyen, ni deben considerarse como, asesoramiento o recomendaciones financieras, de inversión, de trading u otro tipo, proporcionadas o respaldadas por TradingView. Obtenga más información en Condiciones de uso.