

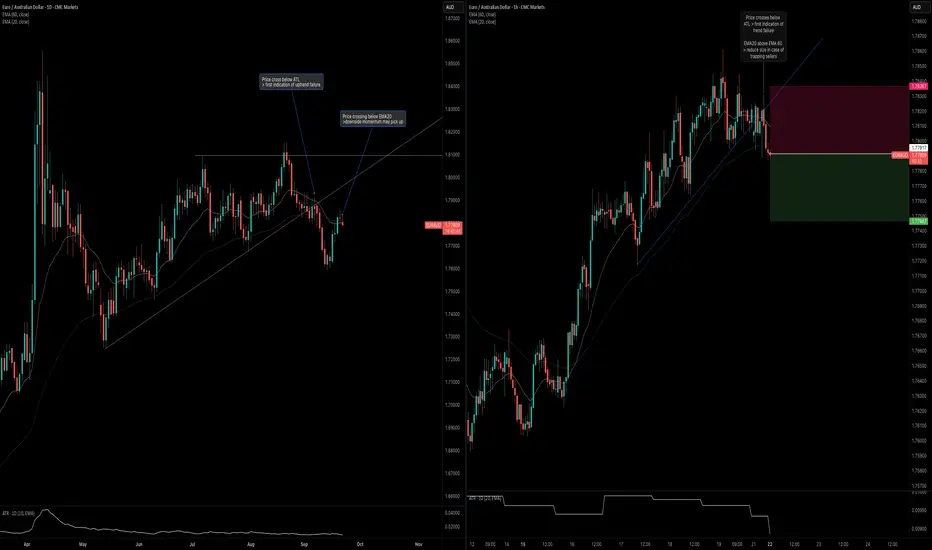
Not my conventional signal as this one is looking to trade in the opposite of the trend.
Daily Timeframe:
H1 Timeframe:
Daily Timeframe:
- EMA20 is barely below EMA60 > downside momentum might pick up
- Price is barely crossing below EMA20 > another indication of downside momentum
- Price crossed below ATL, pulled back, and now seems to be continuing lower
H1 Timeframe:
- Price crosses below ATL > first indication of uptrend failing to continue
- Note that EMA20 is above EMA60 still > there is a risk that this will trap sellers

Exención de responsabilidad
La información y las publicaciones no constituyen, ni deben considerarse como, asesoramiento o recomendaciones financieras, de inversión, de trading u otro tipo, proporcionadas o respaldadas por TradingView. Obtenga más información en Condiciones de uso.
Exención de responsabilidad
La información y las publicaciones no constituyen, ni deben considerarse como, asesoramiento o recomendaciones financieras, de inversión, de trading u otro tipo, proporcionadas o respaldadas por TradingView. Obtenga más información en Condiciones de uso.