

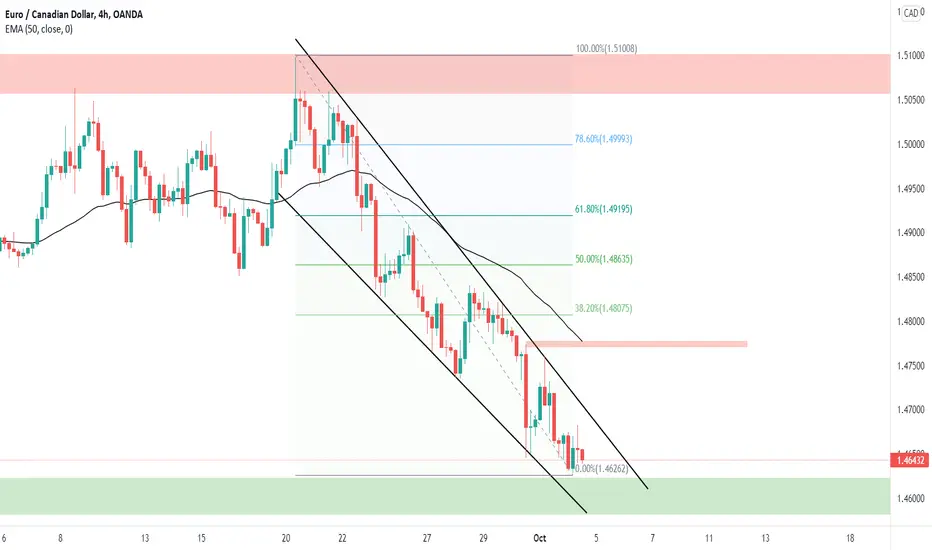
Bullish indicators:
1) Trading near major support area of 1.46100
2) Bullish Harami candle
3) Falling wedge
Bearish Indicators:
1) LL LH
2) Currently trading in downward trend
Plan A: On the bounce from the support area one can buy for the target 1.47733 first and then for the 1.48075.
Plan B: On the breaking of trendline and support one can sell for the target of 1.45826 where the major support lies.
1) Trading near major support area of 1.46100
2) Bullish Harami candle
3) Falling wedge
Bearish Indicators:
1) LL LH
2) Currently trading in downward trend
Plan A: On the bounce from the support area one can buy for the target 1.47733 first and then for the 1.48075.
Plan B: On the breaking of trendline and support one can sell for the target of 1.45826 where the major support lies.

Exención de responsabilidad
La información y las publicaciones no constituyen, ni deben considerarse como, asesoramiento o recomendaciones financieras, de inversión, de trading u otro tipo, proporcionadas o respaldadas por TradingView. Obtenga más información en Condiciones de uso.
Exención de responsabilidad
La información y las publicaciones no constituyen, ni deben considerarse como, asesoramiento o recomendaciones financieras, de inversión, de trading u otro tipo, proporcionadas o respaldadas por TradingView. Obtenga más información en Condiciones de uso.