

1️⃣ Higher-Timeframe Trend Context
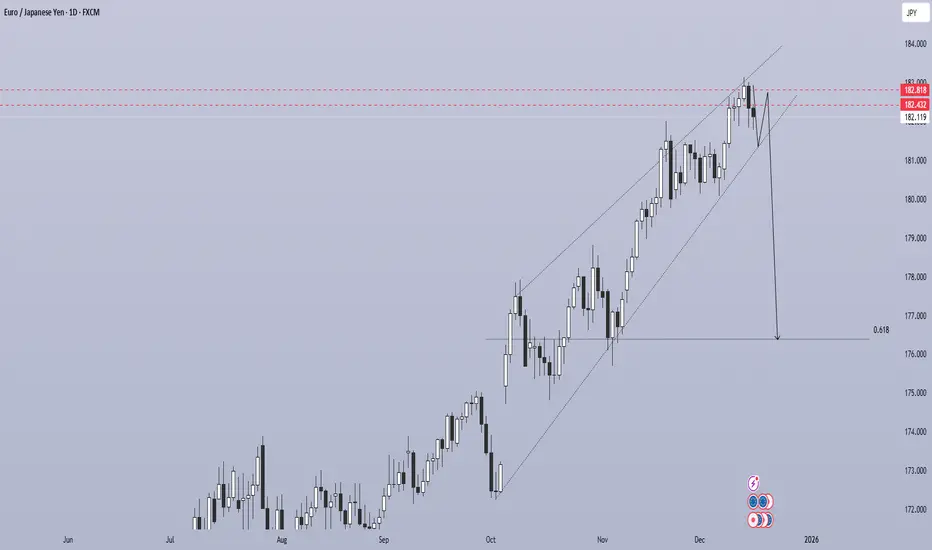
Price has been respecting a clean ascending channel since October
Structure is higher highs & higher lows → bullish trend intact
Momentum, however, is slowing near channel resistance
This suggests trend continuation risk but correction probability is increasing.
2️⃣ Key Resistance & Liquidity Zone
🔴 Supply / Liquidity Area
182.40 – 182.80
This zone aligns with:
Channel upper boundary
Previous swing highs
Buy-side liquidity (equal highs)
Price has already reacted negatively here → early distribution signal.
3️⃣ Price Behavior at the Highs
Multiple upper wicks near 182.8
Failure to hold above resistance
Weak follow-through after breakout attempts
This indicates buy-side liquidity has been taken, and late buyers may be trapped.
4️⃣ Expected Price Path (Primary Scenario)
🔻 Bearish Correction (Preferred Short-Term)
Minor pullback toward 182.0 – 182.2 (intraday reaction)
Failure to reclaim channel top
Breakdown toward 176.5 – 177.0 (mid-channel / prior structure)
Possible deeper move to 176.0 (major horizontal support)
This aligns with your projected arrow.
5️⃣ Alternative Scenario (Bullish Continuation)
Bullish continuation remains valid only if:
Daily close above 182.8
Acceptance above the channel high
Strong bullish displacement (no upper wicks)
In that case, price could extend toward 184.0 – 185.0.
6️⃣ Invalidation Levels
Bearish correction invalidated above 183.0
Strong bearish confirmation below 180.8
Price has been respecting a clean ascending channel since October
Structure is higher highs & higher lows → bullish trend intact
Momentum, however, is slowing near channel resistance
This suggests trend continuation risk but correction probability is increasing.
2️⃣ Key Resistance & Liquidity Zone
🔴 Supply / Liquidity Area
182.40 – 182.80
This zone aligns with:
Channel upper boundary
Previous swing highs
Buy-side liquidity (equal highs)
Price has already reacted negatively here → early distribution signal.
3️⃣ Price Behavior at the Highs
Multiple upper wicks near 182.8
Failure to hold above resistance
Weak follow-through after breakout attempts
This indicates buy-side liquidity has been taken, and late buyers may be trapped.
4️⃣ Expected Price Path (Primary Scenario)
🔻 Bearish Correction (Preferred Short-Term)
Minor pullback toward 182.0 – 182.2 (intraday reaction)
Failure to reclaim channel top
Breakdown toward 176.5 – 177.0 (mid-channel / prior structure)
Possible deeper move to 176.0 (major horizontal support)
This aligns with your projected arrow.
5️⃣ Alternative Scenario (Bullish Continuation)
Bullish continuation remains valid only if:
Daily close above 182.8
Acceptance above the channel high
Strong bullish displacement (no upper wicks)
In that case, price could extend toward 184.0 – 185.0.
6️⃣ Invalidation Levels
Bearish correction invalidated above 183.0
Strong bearish confirmation below 180.8

✅FREE FOREX &CRYPTO SIGNALS TELEGRAM CHANNEL:
t.me/winlouhscalperchannel
t.me/winlouhscalperchannel
Exención de responsabilidad
La información y las publicaciones no constituyen, ni deben considerarse como, asesoramiento o recomendaciones financieras, de inversión, de trading u otro tipo, proporcionadas o respaldadas por TradingView. Obtenga más información en Condiciones de uso.
✅FREE FOREX &CRYPTO SIGNALS TELEGRAM CHANNEL:
t.me/winlouhscalperchannel
t.me/winlouhscalperchannel
Exención de responsabilidad
La información y las publicaciones no constituyen, ni deben considerarse como, asesoramiento o recomendaciones financieras, de inversión, de trading u otro tipo, proporcionadas o respaldadas por TradingView. Obtenga más información en Condiciones de uso.