

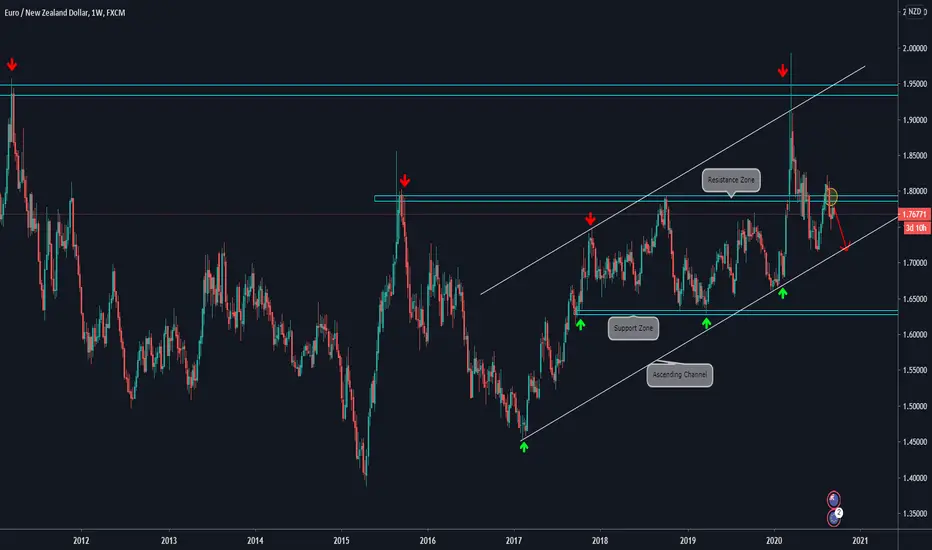
🔸WEEKLY CHART EXPLANATION:
.
.
🔸Price bounced at the Confluence Zone between the Ascending Channel and the Resistance Zone.
.
🔸It did a strong downside move breaking the Support Zone (now Resistance Zone).
.
🔸It has retested the zone again and we observe that was a strong rejection there. We consider that it has potential to reach the Ascending Trendline
.
🔸 Will look for a lower timeframe bearish setup.
🔸 DAILY CHART ANALYSIS:

.
.
🔸Price bounced at the Confluence Zone between the Ascending Channel and the Resistance Zone.
.
🔸It did a strong downside move breaking the Support Zone (now Resistance Zone).
.
🔸It has retested the zone again and we observe that was a strong rejection there. We consider that it has potential to reach the Ascending Trendline
.
🔸 Will look for a lower timeframe bearish setup.
🔸 DAILY CHART ANALYSIS:

Exención de responsabilidad
La información y las publicaciones no constituyen, ni deben considerarse como, asesoramiento o recomendaciones financieras, de inversión, de trading u otro tipo, proporcionadas o respaldadas por TradingView. Obtenga más información en Condiciones de uso.
Exención de responsabilidad
La información y las publicaciones no constituyen, ni deben considerarse como, asesoramiento o recomendaciones financieras, de inversión, de trading u otro tipo, proporcionadas o respaldadas por TradingView. Obtenga más información en Condiciones de uso.