FB (Meta) - Recovery Along Trend Line
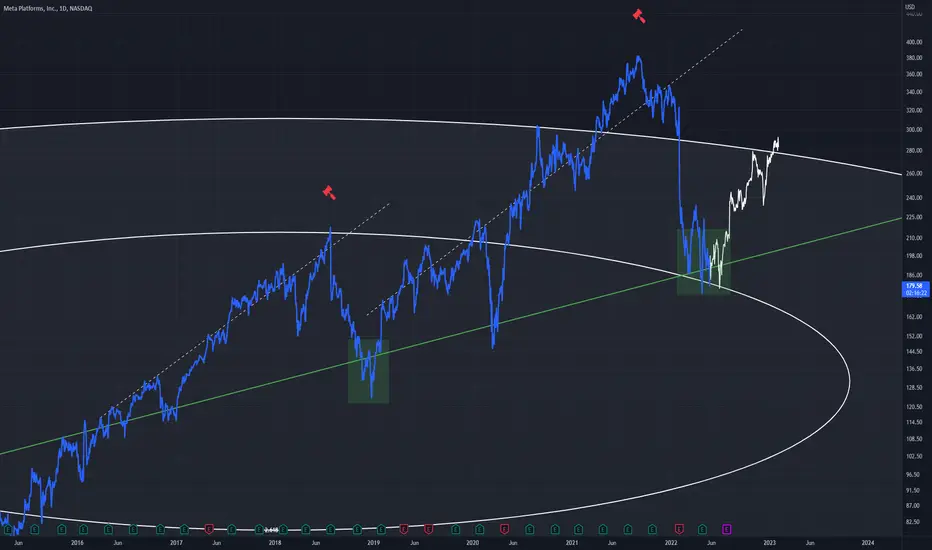
Similarities can be seen between the first dotted upward trend leading to a rejection, and the second also leading to a rejection
Both retrace to the same uptrend
This is the daily chart, with the first rejection at 2.618 and the second at 4.618
Good buy potential on this daily timeframe
Both retrace to the same uptrend
This is the daily chart, with the first rejection at 2.618 and the second at 4.618
Good buy potential on this daily timeframe

Exención de responsabilidad
La información y las publicaciones no constituyen, ni deben considerarse como, asesoramiento o recomendaciones financieras, de inversión, de trading u otro tipo, proporcionadas o respaldadas por TradingView. Obtenga más información en Condiciones de uso.
Exención de responsabilidad
La información y las publicaciones no constituyen, ni deben considerarse como, asesoramiento o recomendaciones financieras, de inversión, de trading u otro tipo, proporcionadas o respaldadas por TradingView. Obtenga más información en Condiciones de uso.