Multi-Timeframe analysis: Facebook (May 2021)
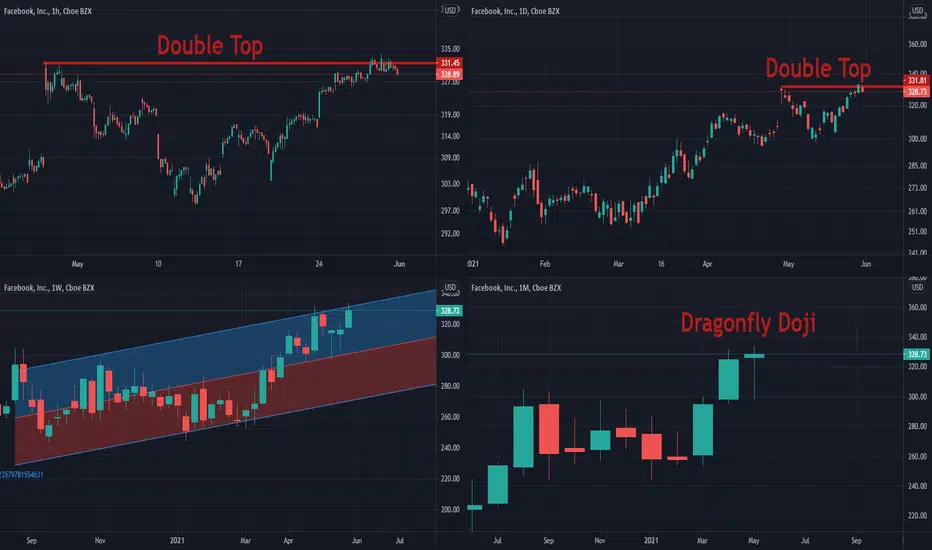
Multi-Timeframe Analysis:
Hourly Chart: Double Top (Bearish)
Daily Chart: Double Top (Bearish)
Weekly Chart: at the top of the regression channel (Bearish)
Monthly Chart: Dragonfly Doji, possible reversal??? (Neutral-Bearish)
Daily average trading value (YTD): Trading 32 % below YTD (money outflow) ( Bearish )
Weekly average trading value: Trading 12% below the last trading year average. (money outflow) ( Bearish )
Monthly average trading value: Trading 5.5% below last trading year average. (money outflow) ( Bearish )
Conclusion: wait for reversal confirmation ( Neutral- Bearish )
Hourly Chart: Double Top (Bearish)
Daily Chart: Double Top (Bearish)
Weekly Chart: at the top of the regression channel (Bearish)
Monthly Chart: Dragonfly Doji, possible reversal??? (Neutral-Bearish)
Daily average trading value (YTD): Trading 32 % below YTD (money outflow) ( Bearish )
Weekly average trading value: Trading 12% below the last trading year average. (money outflow) ( Bearish )
Monthly average trading value: Trading 5.5% below last trading year average. (money outflow) ( Bearish )
Conclusion: wait for reversal confirmation ( Neutral- Bearish )

Use the following link to access trading ideas: patreon.com/SniperTraderStocks?utm_medium=unknown&utm_source=join_link&utm_campaign=creatorshare_creator&utm_content=copyLink
Exención de responsabilidad
La información y las publicaciones no constituyen, ni deben considerarse como, asesoramiento o recomendaciones financieras, de inversión, de trading u otro tipo, proporcionadas o respaldadas por TradingView. Obtenga más información en Condiciones de uso.
Use the following link to access trading ideas: patreon.com/SniperTraderStocks?utm_medium=unknown&utm_source=join_link&utm_campaign=creatorshare_creator&utm_content=copyLink
Exención de responsabilidad
La información y las publicaciones no constituyen, ni deben considerarse como, asesoramiento o recomendaciones financieras, de inversión, de trading u otro tipo, proporcionadas o respaldadas por TradingView. Obtenga más información en Condiciones de uso.