
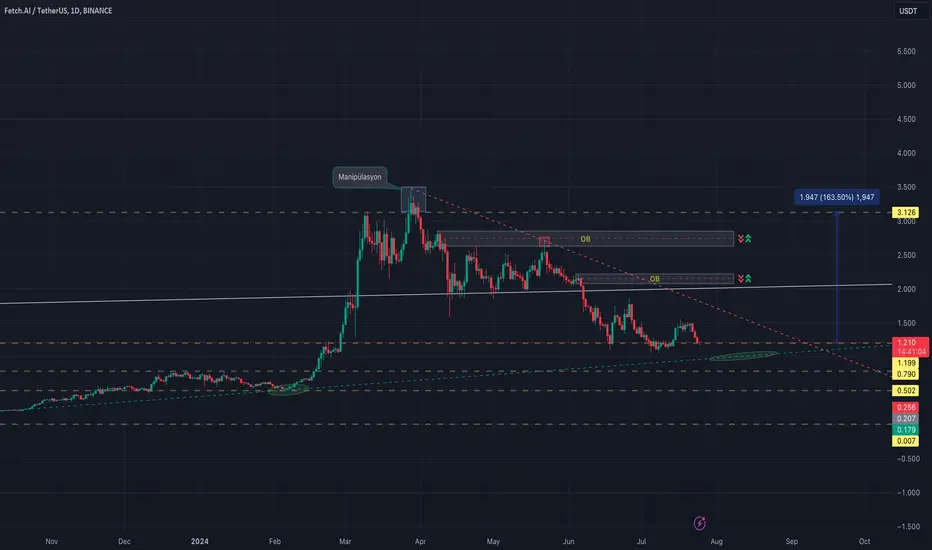
 FET 1D chart;
The $1,199 level is a strong resistance and it seems to be using it as a balance level.
If there is another possible pullback, it may hit the lower trend line.
It is moving towards a narrowing between the trends and it would not be a surprise if it makes an upward move after the squeeze.
We can consider OB levels as possible resistance zones. Therefore, it may make retracements from here.

For more you can follow me on X. @UgurTash
Exención de responsabilidad
La información y las publicaciones no constituyen, ni deben considerarse como, asesoramiento o recomendaciones financieras, de inversión, de trading u otro tipo, proporcionadas o respaldadas por TradingView. Obtenga más información en Condiciones de uso.
For more you can follow me on X. @UgurTash
Exención de responsabilidad
La información y las publicaciones no constituyen, ni deben considerarse como, asesoramiento o recomendaciones financieras, de inversión, de trading u otro tipo, proporcionadas o respaldadas por TradingView. Obtenga más información en Condiciones de uso.