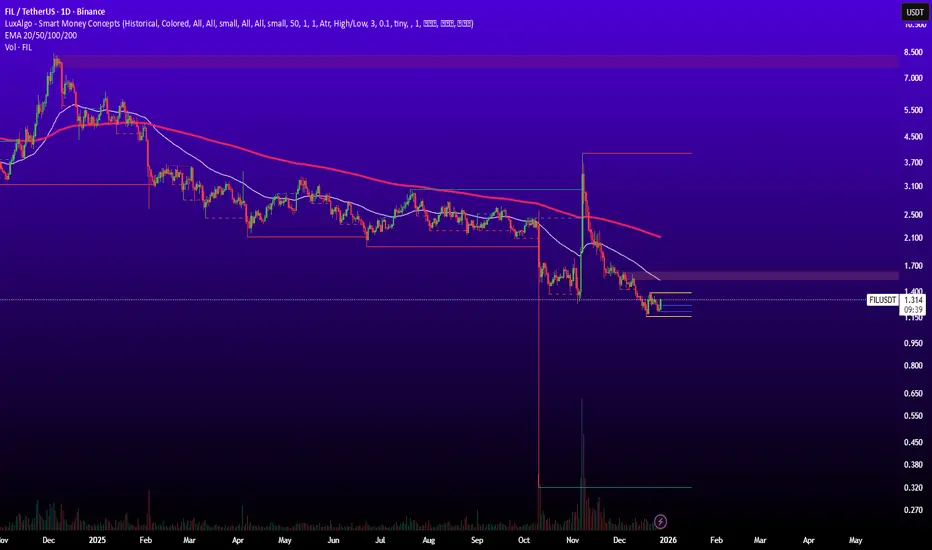
The daily chart of 
 FILUSDT shows an overall bearish structure, but weakening selling pressure and price consolidation suggest that downside momentum is fading at current levels.
Price is moving inside a lower-range trading zone, and a breakout above the range high could be the first sign of a bearish trend correction.
FILUSDT shows an overall bearish structure, but weakening selling pressure and price consolidation suggest that downside momentum is fading at current levels.Price is moving inside a lower-range trading zone, and a breakout above the range high could be the first sign of a bearish trend correction.
- Supports:
- 1.150
- Resistances:
- 1.311
- 1.600 to 1.700
- 2.100
- 2.500

Publicaciones relacionadas
Exención de responsabilidad
La información y las publicaciones no constituyen, ni deben considerarse como, asesoramiento o recomendaciones financieras, de inversión, de trading u otro tipo, proporcionadas o respaldadas por TradingView. Obtenga más información en Condiciones de uso.
Exención de responsabilidad
La información y las publicaciones no constituyen, ni deben considerarse como, asesoramiento o recomendaciones financieras, de inversión, de trading u otro tipo, proporcionadas o respaldadas por TradingView. Obtenga más información en Condiciones de uso.