Fantom Daily Analysis
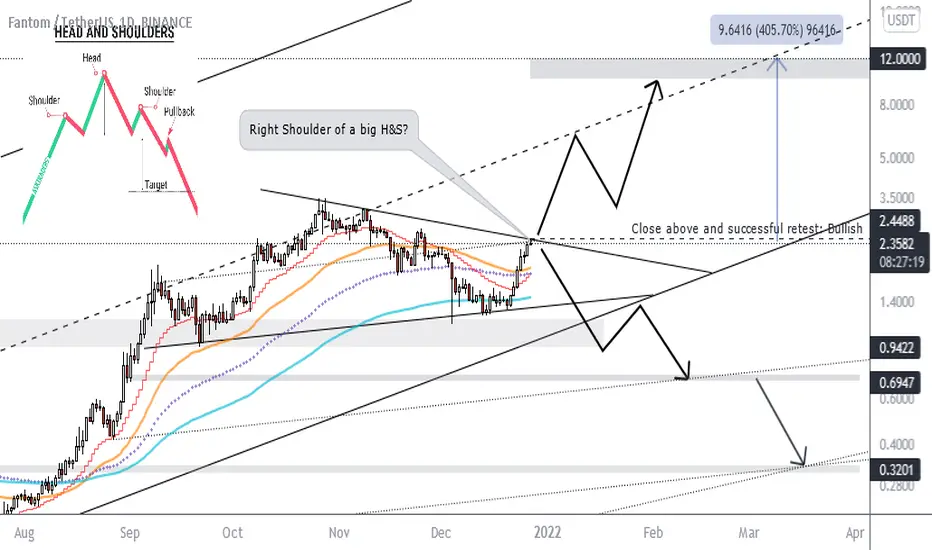
FTM is at the resistance of a triangle and the most important level to determine if it's going to be bullish or bearish. If a daily candle closes above 2.4488 the higher target at $12 is reachable. In another scenario if this level gets rejected the right shoulder of a head and shoulders pattern will be formed and in case of losing the support at $1.4 next supports to hold the price are 0.94, 0.69 and 0.32.

Publicaciones relacionadas
Exención de responsabilidad
La información y las publicaciones no constituyen, ni deben considerarse como, asesoramiento o recomendaciones financieras, de inversión, de trading u otro tipo, proporcionadas o respaldadas por TradingView. Obtenga más información en Condiciones de uso.