FTM
Hi,
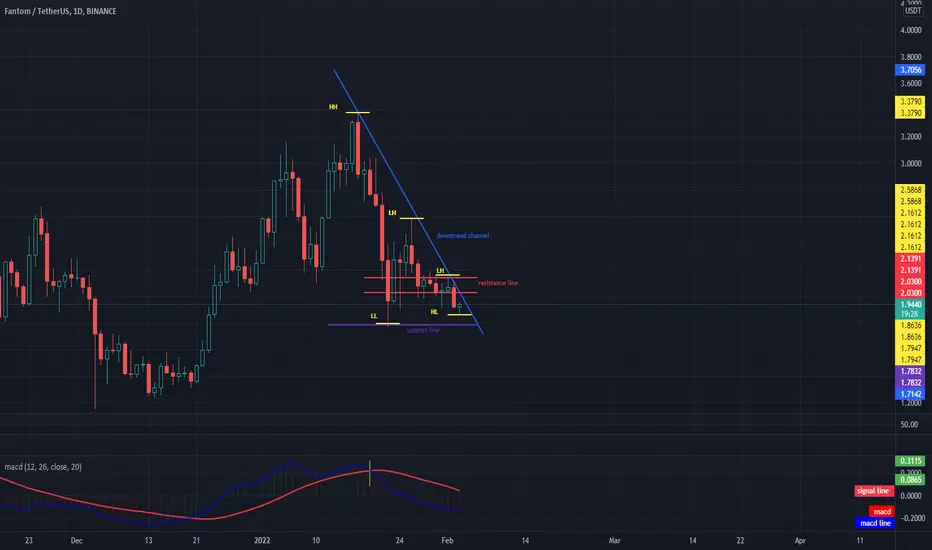
Looking at the FTM / USDT chart, you can see that we are on the uptrend line, while the pattern formed of lower and lower highs and lows indicates a downward trend. Currently, price needs to break a low at $ 2.1612 for a potential trend to reverse. The current support is at $ 1.7832 and the first resistance is at $ 2.03.
Looking at the FTM / USDT chart, you can see that we are on the uptrend line, while the pattern formed of lower and lower highs and lows indicates a downward trend. Currently, price needs to break a low at $ 2.1612 for a potential trend to reverse. The current support is at $ 1.7832 and the first resistance is at $ 2.03.

Exención de responsabilidad
La información y las publicaciones no constituyen, ni deben considerarse como, asesoramiento o recomendaciones financieras, de inversión, de trading u otro tipo, proporcionadas o respaldadas por TradingView. Obtenga más información en Condiciones de uso.
Exención de responsabilidad
La información y las publicaciones no constituyen, ni deben considerarse como, asesoramiento o recomendaciones financieras, de inversión, de trading u otro tipo, proporcionadas o respaldadas por TradingView. Obtenga más información en Condiciones de uso.