

1. The Macro Context (The "Why") 🌍
Hi traders! Before looking at the candles, let's look at the money. My fundamental scoring table is giving us a clear signal: we have a 5-point differential, pointing toward a Bullish bias that we simply can't ignore. 🏦
Key Factor Analysis:
🏦 Current Rates: Explanation: The BoE holds rates at 3.75% — significantly above the G7 average of 2.43% (+1.32pp gap) — while the BoJ remains ultra-dovish at just 0.75%, well below the G7 average (-1.68pp gap). This rate differential clearly and structurally favors GBP over JPY. Score GBP: +1 | Score JPY: -1
🌍 Economic Regime: Explanation: The UK is in an expansionary regime with GDP growing at +0.1% and PMI at 52.9 (rising), pointing to sustained momentum. Japan also shows growth (GDP +0.3%, PMI 53.5) but with mixed signals. Both economies are expanding, yet the UK's inflation trajectory makes it the more hawkish story. Score GBP: +2 | Score JPY: +1
📊 Rate Expectations: Explanation: With UK CPI at 3.3% — above target and on a rising trend — the BoE is more likely to hold or hike than to cut. Japan's inflation sits at just 1.5%, below target and declining, signaling continued BoJ dovishness with no near-term tightening catalyst in sight. Score GBP: +1 | Score JPY: -1
⚖️ Risk Sentiment: Explanation: The current macro backdrop leans mildly risk-on. GBP benefits as a higher-yielding G10 currency in this environment, while JPY — the classic safe-haven — faces outflow pressure when global risk appetite is constructive. The rate divergence reinforces the directional skew. Score GBP: N/A | Score JPY: N/A
🏛️ COT Score: Explanation: Institutional positioning shows shorts being built on GBP (-1), a mild headwind from the speculative community. However, this also introduces squeeze potential: if price breaks out structurally, those short positions become fuel for an accelerated move higher. Score GBP: -1 | Score JPY: N/A
Currency Score Summary:
Total Score GBP: 68/100 (Bullish)
Total Score JPY: 45/100 (Neutral)
Synthesis:
💡 GBP (Bullish, Score 68): Strong rate level advantage over the G7 average, a hawkish inflation trajectory pushing toward a likely hold-or-hike stance, and solid macro data — expanding GDP plus a rising PMI in expansion territory. The only friction is mild short-building in the COT, which is worth monitoring but does not reverse the fundamental bias.
💡 JPY (Neutral, Score 45): Ultra-low rates far below the G7 average, inflation declining and below the BoJ's own target, and mixed macro data keep the yen structurally weak. Japan's GDP is growing and unemployment is falling, which prevents a full bearish score — but the BoJ has no credible catalyst to tighten, and that caps any sustained JPY strength.
Conclusion: Given this fundamental backdrop, we are strictly looking for Long setups. Going against this bias would be statistical suicide. 🚫
2. Daily Trend Confirmation (The "Structural Filter") 📅
Macro tells us where the wind blows; the daily chart tells us if the price is actually moving with it. For every swing setup I take, the 1D structure must confirm the macro direction — otherwise the trade is just a guess against the tape.
📅 Daily Trend: Uptrend — perfectly aligned with the bullish macro bias. The daily chart is printing higher highs and higher lows, confirming that structural momentum is running in the same direction as the fundamental story. Price and macro are speaking the same language.
🔄 Daily Phase: Monitoring for new breakout — the indicator just validated a new higher high on the daily, meaning we are entering the new impulse leg or its pullback. This is the highest-quality entry window in the entire cycle: the structure has just reset and the next leg is beginning.
Coherence Check: The 1D trend is aligned with the macro bias. This is a high-conviction swing — both the fundamentals and the structural daily timing point in the same direction.
3. The Technical Setup (The "Where") 📉
Timeframe: 4H | Pair: GBPJPY
The SMC Market Structure + Price Zones [MaB] indicator has confirmed our statistical edge. Here's the probabilistic data from the dashboard:
🚀 Continuation Rate (74.7%): We are currently above the 60% threshold. This confirms a healthy directional trend where continuation has a much higher probability than a reversal.
🔥 Streak Analysis (0): We are currently on impulse number 0.
* Expected Streak: 3 (Percentile: 50%)
* Remaining Moves: 3
This indicates a Young trend. The statistical range (20th-80th pct) suggests a typical duration of 2-7 impulses.
🔄 Retest & Reaction:
* Retest Prob (77.1%): The probability of the price returning to test the zone after a BOS.
* BOS/Ret Rate (72.2%): Once inside the zone, this is the probability of a positive reaction leading to a new BOS.
🎯 Extension & Projection:
* Extension Range: The expected extension for this single leg is between 1.58x and 2.91x (Expected: 1.87x).
* Compound Extension (3.61x): This is the total projected move based on the remaining expected impulses. By multiplying the current zone height by this factor, we find our ultimate target.
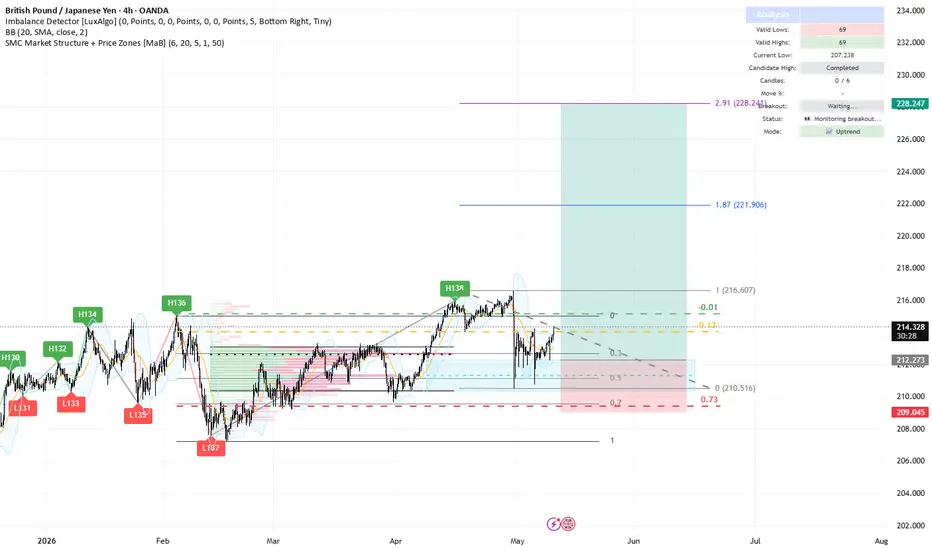
4. Execution Plan on Chart 🎯
Moving over to the charts, we are using these statistics to define our operational levels:
📍 Entry and Stop Loss: We are placing a limit entry within the Supply Zone 4H (Purple/Pink Band). The stop loss is tucked a few pips outside the zone to protect against structural invalidation.
🏁 Statistical Take Profits (50/30/20 split): Instead of a single arbitrary target, we split the position across 3 extension levels projected by the indicator. Each TP closes a portion of the position to lock in profit progressively. 🏆
Trade Parameters:
💰 Entry Price: 216.607
🛡️ Stop Loss: 209.045
🎯 Take Profit Strategy (50/30/20 lot split):
* TP1 (close 50% of position): 221.906 — 1.87x extension
* TP2 (close 30% of position): 228.241 — 2.91x extension
* TP3 (close 20% of position): N/A — N/A extension
The 50/30/20 split secures profit at the statistically conservative target (TP1) while letting a portion ride toward the max extension (TP3).
⚠️ Disclaimer: This analysis is based on a proprietary algorithm and is shared exclusively for educational and didactic purposes. It does not constitute financial advice or investment solicitation in any way. Trading involves significant risk.
Hi traders! Before looking at the candles, let's look at the money. My fundamental scoring table is giving us a clear signal: we have a 5-point differential, pointing toward a Bullish bias that we simply can't ignore. 🏦
Key Factor Analysis:
🏦 Current Rates: Explanation: The BoE holds rates at 3.75% — significantly above the G7 average of 2.43% (+1.32pp gap) — while the BoJ remains ultra-dovish at just 0.75%, well below the G7 average (-1.68pp gap). This rate differential clearly and structurally favors GBP over JPY. Score GBP: +1 | Score JPY: -1
🌍 Economic Regime: Explanation: The UK is in an expansionary regime with GDP growing at +0.1% and PMI at 52.9 (rising), pointing to sustained momentum. Japan also shows growth (GDP +0.3%, PMI 53.5) but with mixed signals. Both economies are expanding, yet the UK's inflation trajectory makes it the more hawkish story. Score GBP: +2 | Score JPY: +1
📊 Rate Expectations: Explanation: With UK CPI at 3.3% — above target and on a rising trend — the BoE is more likely to hold or hike than to cut. Japan's inflation sits at just 1.5%, below target and declining, signaling continued BoJ dovishness with no near-term tightening catalyst in sight. Score GBP: +1 | Score JPY: -1
⚖️ Risk Sentiment: Explanation: The current macro backdrop leans mildly risk-on. GBP benefits as a higher-yielding G10 currency in this environment, while JPY — the classic safe-haven — faces outflow pressure when global risk appetite is constructive. The rate divergence reinforces the directional skew. Score GBP: N/A | Score JPY: N/A
🏛️ COT Score: Explanation: Institutional positioning shows shorts being built on GBP (-1), a mild headwind from the speculative community. However, this also introduces squeeze potential: if price breaks out structurally, those short positions become fuel for an accelerated move higher. Score GBP: -1 | Score JPY: N/A
Currency Score Summary:
Total Score GBP: 68/100 (Bullish)
Total Score JPY: 45/100 (Neutral)
Synthesis:
💡 GBP (Bullish, Score 68): Strong rate level advantage over the G7 average, a hawkish inflation trajectory pushing toward a likely hold-or-hike stance, and solid macro data — expanding GDP plus a rising PMI in expansion territory. The only friction is mild short-building in the COT, which is worth monitoring but does not reverse the fundamental bias.
💡 JPY (Neutral, Score 45): Ultra-low rates far below the G7 average, inflation declining and below the BoJ's own target, and mixed macro data keep the yen structurally weak. Japan's GDP is growing and unemployment is falling, which prevents a full bearish score — but the BoJ has no credible catalyst to tighten, and that caps any sustained JPY strength.
Conclusion: Given this fundamental backdrop, we are strictly looking for Long setups. Going against this bias would be statistical suicide. 🚫
2. Daily Trend Confirmation (The "Structural Filter") 📅
Macro tells us where the wind blows; the daily chart tells us if the price is actually moving with it. For every swing setup I take, the 1D structure must confirm the macro direction — otherwise the trade is just a guess against the tape.
📅 Daily Trend: Uptrend — perfectly aligned with the bullish macro bias. The daily chart is printing higher highs and higher lows, confirming that structural momentum is running in the same direction as the fundamental story. Price and macro are speaking the same language.
🔄 Daily Phase: Monitoring for new breakout — the indicator just validated a new higher high on the daily, meaning we are entering the new impulse leg or its pullback. This is the highest-quality entry window in the entire cycle: the structure has just reset and the next leg is beginning.
Coherence Check: The 1D trend is aligned with the macro bias. This is a high-conviction swing — both the fundamentals and the structural daily timing point in the same direction.
3. The Technical Setup (The "Where") 📉
Timeframe: 4H | Pair: GBPJPY
The SMC Market Structure + Price Zones [MaB] indicator has confirmed our statistical edge. Here's the probabilistic data from the dashboard:
🚀 Continuation Rate (74.7%): We are currently above the 60% threshold. This confirms a healthy directional trend where continuation has a much higher probability than a reversal.
🔥 Streak Analysis (0): We are currently on impulse number 0.
* Expected Streak: 3 (Percentile: 50%)
* Remaining Moves: 3
This indicates a Young trend. The statistical range (20th-80th pct) suggests a typical duration of 2-7 impulses.
🔄 Retest & Reaction:
* Retest Prob (77.1%): The probability of the price returning to test the zone after a BOS.
* BOS/Ret Rate (72.2%): Once inside the zone, this is the probability of a positive reaction leading to a new BOS.
🎯 Extension & Projection:
* Extension Range: The expected extension for this single leg is between 1.58x and 2.91x (Expected: 1.87x).
* Compound Extension (3.61x): This is the total projected move based on the remaining expected impulses. By multiplying the current zone height by this factor, we find our ultimate target.
4. Execution Plan on Chart 🎯
Moving over to the charts, we are using these statistics to define our operational levels:
📍 Entry and Stop Loss: We are placing a limit entry within the Supply Zone 4H (Purple/Pink Band). The stop loss is tucked a few pips outside the zone to protect against structural invalidation.
🏁 Statistical Take Profits (50/30/20 split): Instead of a single arbitrary target, we split the position across 3 extension levels projected by the indicator. Each TP closes a portion of the position to lock in profit progressively. 🏆
Trade Parameters:
💰 Entry Price: 216.607
🛡️ Stop Loss: 209.045
🎯 Take Profit Strategy (50/30/20 lot split):
* TP1 (close 50% of position): 221.906 — 1.87x extension
* TP2 (close 30% of position): 228.241 — 2.91x extension
* TP3 (close 20% of position): N/A — N/A extension
The 50/30/20 split secures profit at the statistically conservative target (TP1) while letting a portion ride toward the max extension (TP3).
⚠️ Disclaimer: This analysis is based on a proprietary algorithm and is shared exclusively for educational and didactic purposes. It does not constitute financial advice or investment solicitation in any way. Trading involves significant risk.

Trading indicators development focused on Smart Money Concepts (SMC), market structure analysis, and liquidity zones.
WEBSITE: mab-arreca.com/
WHOP: whop.com/mab-9cb1/
YOUTUBE: youtube.com/@MaB.arreca
WEBSITE: mab-arreca.com/
WHOP: whop.com/mab-9cb1/
YOUTUBE: youtube.com/@MaB.arreca
Publicaciones relacionadas
Exención de responsabilidad
La información y las publicaciones no constituyen, ni deben considerarse como, asesoramiento o recomendaciones financieras, de inversión, de trading u otro tipo, proporcionadas o respaldadas por TradingView. Obtenga más información en Condiciones de uso.
Trading indicators development focused on Smart Money Concepts (SMC), market structure analysis, and liquidity zones.
WEBSITE: mab-arreca.com/
WHOP: whop.com/mab-9cb1/
YOUTUBE: youtube.com/@MaB.arreca
WEBSITE: mab-arreca.com/
WHOP: whop.com/mab-9cb1/
YOUTUBE: youtube.com/@MaB.arreca
Publicaciones relacionadas
Exención de responsabilidad
La información y las publicaciones no constituyen, ni deben considerarse como, asesoramiento o recomendaciones financieras, de inversión, de trading u otro tipo, proporcionadas o respaldadas por TradingView. Obtenga más información en Condiciones de uso.