

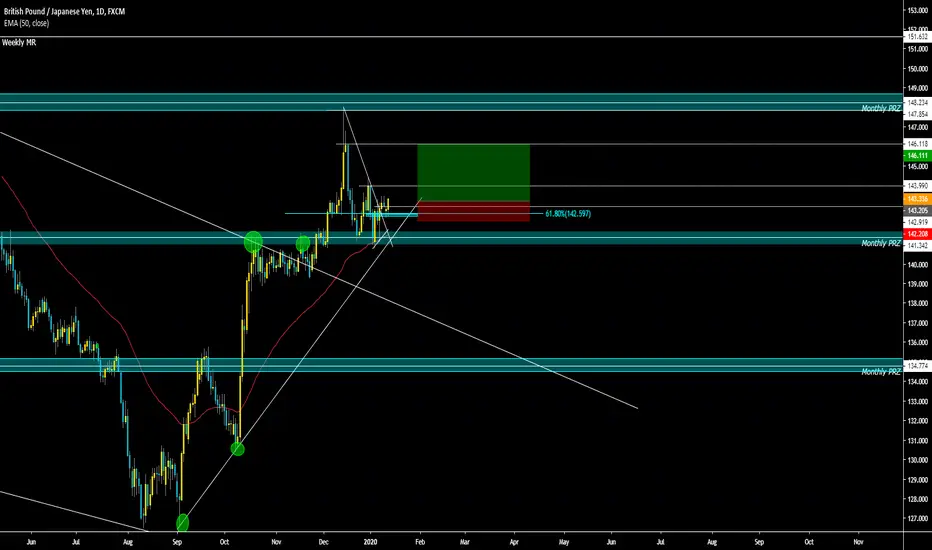
Daily timeframe is giving us signs of a possible new bullish momentum where right nice we can see how price failed to break right below the previous bearish structure that lines up with the monthly PRZ,EMA,ascendign daily TL and daily support going back to the 143.00 area after 4 tries to break below it so if daily close above the mentioned level and keep holdin above the 61% fib we might see a push atleast to the 146.00 area

Exención de responsabilidad
La información y las publicaciones no constituyen, ni deben considerarse como, asesoramiento o recomendaciones financieras, de inversión, de trading u otro tipo, proporcionadas o respaldadas por TradingView. Obtenga más información en Condiciones de uso.
Exención de responsabilidad
La información y las publicaciones no constituyen, ni deben considerarse como, asesoramiento o recomendaciones financieras, de inversión, de trading u otro tipo, proporcionadas o respaldadas por TradingView. Obtenga más información en Condiciones de uso.