Market Analysis: GBP/USD Declines As Dollar Sees Mixed Flows
Market Analysis: GBP/USD Declines As Dollar Sees Mixed Flows
GBP/USD started a downside correction from the 1.3470 zone.
Important Takeaways for GBP/USD Analysis Today
- The British Pound started a fresh decline and settled below the 1.3400 zone.
- There is a connecting bearish trend line forming with resistance at 1.3330 on the hourly chart of GBP/USD.
GBP/USD Technical Analysis
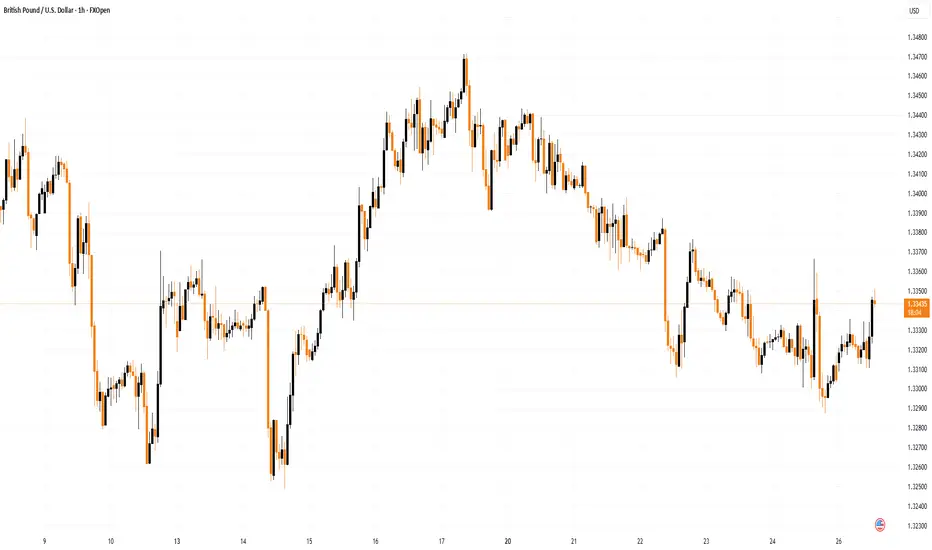
On the hourly chart of GBP/USD, the pair struggled above 1.3450. The British Pound started a fresh decline below 1.3400 against the US Dollar, as discussed in the previous analysis.
The pair dipped below the 1.3350 and 1.3300 levels. A low was formed at 1.32874 and the pair is now consolidating losses. On the upside, the pair is facing resistance near 1.3330 and a bearish trend line. It is close to the 23.6% Fib retracement level of the downward move from the 1.3471 swing high to the 1.3287 low.

The next key hurdle on the GBP/USD chart could be near the 50% Fib retracement at 1.3380. The main breakout zone is 1.3400. An upside break above 1.3400 could send the pair toward 1.3470.
Any more gains might open the doors for a test of 1.3500. If there is another decline, the pair could find support near 1.3285. The first key zone for the bulls might be 1.3250. A clear move below 1.3250 might send GBP/USD toward 1.3220. The next target for the bears might be 1.3200, below which the price could dive and test 1.3050.
This article represents the opinion of the Companies operating under the FXOpen brand only. It is not to be construed as an offer, solicitation, or recommendation with respect to products and services provided by the Companies operating under the FXOpen brand, nor is it to be considered financial advice.
GBP/USD started a downside correction from the 1.3470 zone.
Important Takeaways for GBP/USD Analysis Today
- The British Pound started a fresh decline and settled below the 1.3400 zone.
- There is a connecting bearish trend line forming with resistance at 1.3330 on the hourly chart of GBP/USD.
GBP/USD Technical Analysis
On the hourly chart of GBP/USD, the pair struggled above 1.3450. The British Pound started a fresh decline below 1.3400 against the US Dollar, as discussed in the previous analysis.
The pair dipped below the 1.3350 and 1.3300 levels. A low was formed at 1.32874 and the pair is now consolidating losses. On the upside, the pair is facing resistance near 1.3330 and a bearish trend line. It is close to the 23.6% Fib retracement level of the downward move from the 1.3471 swing high to the 1.3287 low.
The next key hurdle on the GBP/USD chart could be near the 50% Fib retracement at 1.3380. The main breakout zone is 1.3400. An upside break above 1.3400 could send the pair toward 1.3470.
Any more gains might open the doors for a test of 1.3500. If there is another decline, the pair could find support near 1.3285. The first key zone for the bulls might be 1.3250. A clear move below 1.3250 might send GBP/USD toward 1.3220. The next target for the bears might be 1.3200, below which the price could dive and test 1.3050.
This article represents the opinion of the Companies operating under the FXOpen brand only. It is not to be construed as an offer, solicitation, or recommendation with respect to products and services provided by the Companies operating under the FXOpen brand, nor is it to be considered financial advice.

Exención de responsabilidad
La información y las publicaciones no constituyen, ni deben considerarse como, asesoramiento o recomendaciones financieras, de inversión, de trading u otro tipo, proporcionadas o respaldadas por TradingView. Obtenga más información en Condiciones de uso.
Exención de responsabilidad
La información y las publicaciones no constituyen, ni deben considerarse como, asesoramiento o recomendaciones financieras, de inversión, de trading u otro tipo, proporcionadas o respaldadas por TradingView. Obtenga más información en Condiciones de uso.