

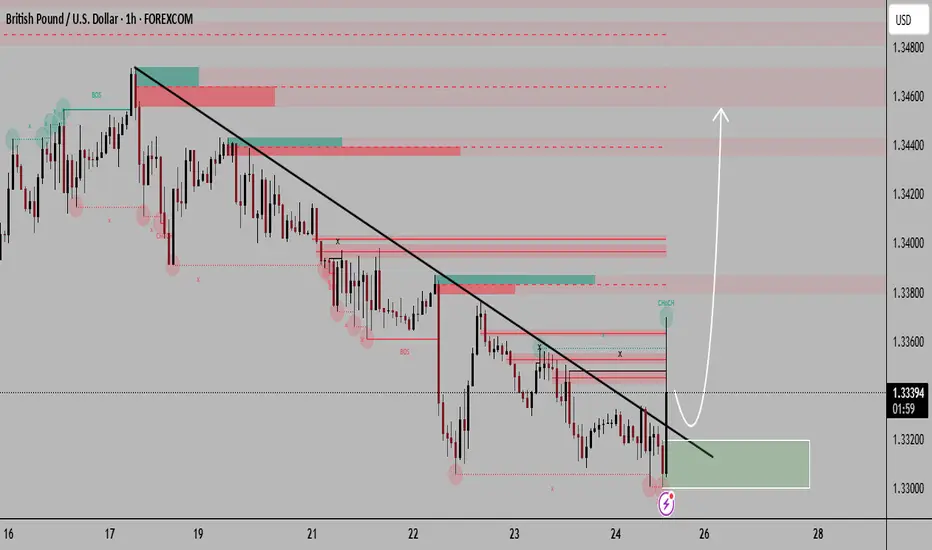
This chart shows GBP/USD (British Pound vs US Dollar) on the 1-hour timeframe with a technical setup suggesting a potential bullish reversal.
Here’s a concise breakdown:
Downtrend Line (Black Line) – Price has been respecting a descending trendline, indicating consistent lower highs (bearish momentum).
Change of Character (ChoCH) – A “ChoCH” label appears near 1.335, suggesting that the market may be shifting from bearish to bullish structure — the first sign of a possible trend reversal.
Demand Zone (Green Box) – Around 1.3300–1.3320, this zone represents an area where buyers are expected to step in (potential reversal point).
Bullish Scenario (White Arrow) – The arrow forecasts price to:
Tap into the green demand zone,
Bounce upward, breaking the downtrend line,
Target higher resistance/supply zones near 1.3400–1.3460.
Supply Zones (Red Areas) – Mark previous sell zones or resistance levels where price could react during the upward move.
Summary:
Price is in a downtrend but showing early reversal signs (ChoCH). A bounce from the green demand zone could lead to a bullish move toward the upper resistance zones.
Here’s a concise breakdown:
Downtrend Line (Black Line) – Price has been respecting a descending trendline, indicating consistent lower highs (bearish momentum).
Change of Character (ChoCH) – A “ChoCH” label appears near 1.335, suggesting that the market may be shifting from bearish to bullish structure — the first sign of a possible trend reversal.
Demand Zone (Green Box) – Around 1.3300–1.3320, this zone represents an area where buyers are expected to step in (potential reversal point).
Bullish Scenario (White Arrow) – The arrow forecasts price to:
Tap into the green demand zone,
Bounce upward, breaking the downtrend line,
Target higher resistance/supply zones near 1.3400–1.3460.
Supply Zones (Red Areas) – Mark previous sell zones or resistance levels where price could react during the upward move.
Summary:
Price is in a downtrend but showing early reversal signs (ChoCH). A bounce from the green demand zone could lead to a bullish move toward the upper resistance zones.

Exención de responsabilidad
La información y las publicaciones no constituyen, ni deben considerarse como, asesoramiento o recomendaciones financieras, de inversión, de trading u otro tipo, proporcionadas o respaldadas por TradingView. Obtenga más información en Condiciones de uso.
Exención de responsabilidad
La información y las publicaciones no constituyen, ni deben considerarse como, asesoramiento o recomendaciones financieras, de inversión, de trading u otro tipo, proporcionadas o respaldadas por TradingView. Obtenga más información en Condiciones de uso.