

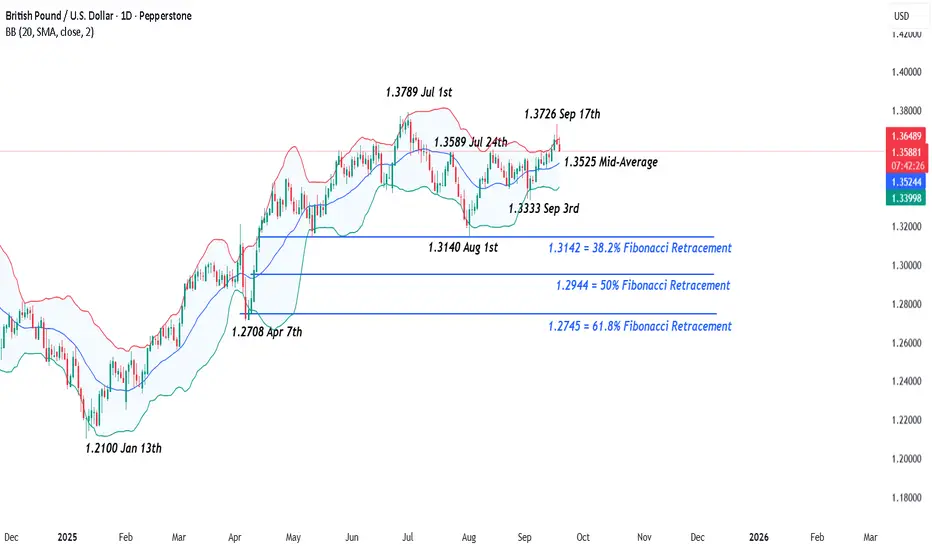
As a trader it can be helpful to use a Pepperstone chart to assess the price action of a particular market that you are considering taking a position in ahead of a big event, like a Federal Reserve (Fed) or Bank of England (BoE) interest rate decision, as it could assist in providing an insight into the bias of the wider market as they anticipate the outcome of the central bank meetings and position accordingly.
At the start of this week, the general thinking amongst observers seemed to be that the Fed were going to cut interest rates, which as a rule may lead to a weaker dollar (USD), and that the BoE were going to remain on hold due to sticky UK wage growth and stubbornly high inflation, the highest in the G7, an outcome that as a rule may be more supportive of GBP.
Perhaps, unsurprisingly then, in this environment GBPUSD at the start of this week edged higher between the Monday open around 1.3540 and Wednesday afternoon, circa 1.3660, with trader assumptions on the UK (GBP) side further supported by UK wage data (Tues) and Inflation Data (Wed CPI) backing up their hypothesis.
However, this is where it gets tricky, the GBPUSD rally to 2 months highs (1.3671) then ran into a wall of profit taking as traders locked in some profits on gains and waited for more clarity on what the Fed was thinking regarding interest rate moves into the end of 2025.
Ahead of the meeting, yes, a 25bps (0.25%) cut was expected, but there was an outside chance of a 50bps (0.5%) move being priced by the markets. Also, there was some uncertainty regarding what the Fed would signal regarding further interest rate moves. Would Fed Chairman Powell signal it was just one cut and done, or would he signal the potential for the US central bank to cut interest rates further at their meetings in late October and December?
The answers to these questions can often mean only one thing, an increase in GBPUSD volatility, and that’s what we got. GBPUSD traded quickly to a new 2 month high of 1.3726 but then ran out of steam, as buying momentum stalled sending prices back to a current low of 1.3593 this morning (0700 BST).
Now, looking forward to the BoE rate decision released later today at 1200 BST, it could be helpful to move back to the Pepperstone charts again and try to identify potential support and resistance levels that could be monitored in case this volatility continues into the Friday close.
Technical Update: Positive Start so Far in September
Much like the start of August, initial price activity in September has shown strength for GBPUSD, rallying from the 1.3333 low on September 3rd to a latest high of 1.3726 on September 17th. This may be viewed by some traders as suggesting further phases of price strength are possible if resistance levels continue to be broken.

Perhaps what stands out in September’s GBPUSD rally, is the successful closing break above 1.3589, the July 24th high resistance. While this move doesn’t guarantee continued upside, it may see further attempts to push toward higher levels.
That said, as already discussed, there is potential for increased GBPUSD volatility ahead, so it may prove useful to be aware of potential support and resistance levels to monitor over coming sessions.
Possible Resistance Levels:
It has already been an impressive recovery since the 1.3333 September 3rd low, although it might be argued that price strength is again encountering resistance at these higher levels. Having run into sellers at 1.3726 after yesterday’s initial reaction to the cut in US interest rates, they may be found there again. As such, 1.3726 could now be viewed as first resistance, if further price strength materialises.
However, if a daily closing break above the 1.3726 resistance does materialise, while not guaranteed, it could pave the way for further upside, with next the potential resistance sitting at 1.3789, which is the July 1st session high.
Potential Support Levels:
Much may appear to depend on whether GBPUSD can achieve a successful daily close above the 1.3726 resistance level. However, while this continues to cap price strength, risks could be for price declines, possibly toward potential support levels.
The Bollinger mid-average, currently at 1.3525, may now be a support focus for traders. A close below this level, if seen, could be a catalyst for further price weakness, potentially leading to a fresh decline toward 1.3333, the September 3rd low.
The material provided here has not been prepared accordance with legal requirements designed to promote the independence of investment research and as such is considered to be a marketing communication. Whilst it is not subject to any prohibition on dealing ahead of the dissemination of investment research, we will not seek to take any advantage before providing it to our clients.
Pepperstone doesn’t represent that the material provided here is accurate, current or complete, and therefore shouldn’t be relied upon as such. The information, whether from a third party or not, isn’t to be considered as a recommendation; or an offer to buy or sell; or the solicitation of an offer to buy or sell any security, financial product or instrument; or to participate in any particular trading strategy. It does not take into account readers’ financial situation or investment objectives. We advise any readers of this content to seek their own advice. Without the approval of Pepperstone, reproduction or redistribution of this information isn’t permitted.
At the start of this week, the general thinking amongst observers seemed to be that the Fed were going to cut interest rates, which as a rule may lead to a weaker dollar (USD), and that the BoE were going to remain on hold due to sticky UK wage growth and stubbornly high inflation, the highest in the G7, an outcome that as a rule may be more supportive of GBP.
Perhaps, unsurprisingly then, in this environment GBPUSD at the start of this week edged higher between the Monday open around 1.3540 and Wednesday afternoon, circa 1.3660, with trader assumptions on the UK (GBP) side further supported by UK wage data (Tues) and Inflation Data (Wed CPI) backing up their hypothesis.
However, this is where it gets tricky, the GBPUSD rally to 2 months highs (1.3671) then ran into a wall of profit taking as traders locked in some profits on gains and waited for more clarity on what the Fed was thinking regarding interest rate moves into the end of 2025.
Ahead of the meeting, yes, a 25bps (0.25%) cut was expected, but there was an outside chance of a 50bps (0.5%) move being priced by the markets. Also, there was some uncertainty regarding what the Fed would signal regarding further interest rate moves. Would Fed Chairman Powell signal it was just one cut and done, or would he signal the potential for the US central bank to cut interest rates further at their meetings in late October and December?
The answers to these questions can often mean only one thing, an increase in GBPUSD volatility, and that’s what we got. GBPUSD traded quickly to a new 2 month high of 1.3726 but then ran out of steam, as buying momentum stalled sending prices back to a current low of 1.3593 this morning (0700 BST).
Now, looking forward to the BoE rate decision released later today at 1200 BST, it could be helpful to move back to the Pepperstone charts again and try to identify potential support and resistance levels that could be monitored in case this volatility continues into the Friday close.
Technical Update: Positive Start so Far in September
Much like the start of August, initial price activity in September has shown strength for GBPUSD, rallying from the 1.3333 low on September 3rd to a latest high of 1.3726 on September 17th. This may be viewed by some traders as suggesting further phases of price strength are possible if resistance levels continue to be broken.
Perhaps what stands out in September’s GBPUSD rally, is the successful closing break above 1.3589, the July 24th high resistance. While this move doesn’t guarantee continued upside, it may see further attempts to push toward higher levels.
That said, as already discussed, there is potential for increased GBPUSD volatility ahead, so it may prove useful to be aware of potential support and resistance levels to monitor over coming sessions.
Possible Resistance Levels:
It has already been an impressive recovery since the 1.3333 September 3rd low, although it might be argued that price strength is again encountering resistance at these higher levels. Having run into sellers at 1.3726 after yesterday’s initial reaction to the cut in US interest rates, they may be found there again. As such, 1.3726 could now be viewed as first resistance, if further price strength materialises.
However, if a daily closing break above the 1.3726 resistance does materialise, while not guaranteed, it could pave the way for further upside, with next the potential resistance sitting at 1.3789, which is the July 1st session high.
Potential Support Levels:
Much may appear to depend on whether GBPUSD can achieve a successful daily close above the 1.3726 resistance level. However, while this continues to cap price strength, risks could be for price declines, possibly toward potential support levels.
The Bollinger mid-average, currently at 1.3525, may now be a support focus for traders. A close below this level, if seen, could be a catalyst for further price weakness, potentially leading to a fresh decline toward 1.3333, the September 3rd low.
The material provided here has not been prepared accordance with legal requirements designed to promote the independence of investment research and as such is considered to be a marketing communication. Whilst it is not subject to any prohibition on dealing ahead of the dissemination of investment research, we will not seek to take any advantage before providing it to our clients.
Pepperstone doesn’t represent that the material provided here is accurate, current or complete, and therefore shouldn’t be relied upon as such. The information, whether from a third party or not, isn’t to be considered as a recommendation; or an offer to buy or sell; or the solicitation of an offer to buy or sell any security, financial product or instrument; or to participate in any particular trading strategy. It does not take into account readers’ financial situation or investment objectives. We advise any readers of this content to seek their own advice. Without the approval of Pepperstone, reproduction or redistribution of this information isn’t permitted.

Global risk Warning CFDs are complex instruments and come with a high risk of losing money rapidly due to leverage. Between 74-89% of retail investor accounts lose money when trading in CFDs. You should consider whether you understand how CFD
Exención de responsabilidad
La información y las publicaciones no constituyen, ni deben considerarse como, asesoramiento o recomendaciones financieras, de inversión, de trading u otro tipo, proporcionadas o respaldadas por TradingView. Obtenga más información en Condiciones de uso.
Global risk Warning CFDs are complex instruments and come with a high risk of losing money rapidly due to leverage. Between 74-89% of retail investor accounts lose money when trading in CFDs. You should consider whether you understand how CFD
Exención de responsabilidad
La información y las publicaciones no constituyen, ni deben considerarse como, asesoramiento o recomendaciones financieras, de inversión, de trading u otro tipo, proporcionadas o respaldadas por TradingView. Obtenga más información en Condiciones de uso.