
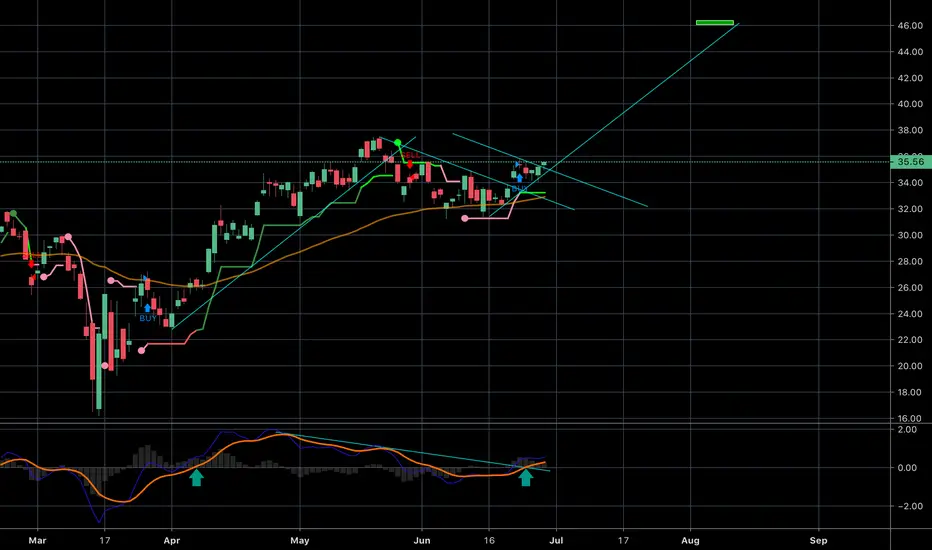
As shown in the daily GDX chart, the turquoise trend lines mark the support resistance trend lines, as well as show a standard flag pattern. Previous upside target in 2019 was 36, it now is upgraded to 46, based on chart pattern and Fibonacci projections.
Recent price action saw a gap above the trend line resistance, and consolidation before yet another gap up (over a minor parallel trend line resistance).
Also observed that MACD is supportive with a break up cross into the bullish territory, and a break above the MACD trend line at about the same time.
Bullish, target 46, around mid-August 2020.
Recent price action saw a gap above the trend line resistance, and consolidation before yet another gap up (over a minor parallel trend line resistance).
Also observed that MACD is supportive with a break up cross into the bullish territory, and a break above the MACD trend line at about the same time.
Bullish, target 46, around mid-August 2020.

Publicaciones relacionadas
Exención de responsabilidad
La información y las publicaciones no constituyen, ni deben considerarse como, asesoramiento o recomendaciones financieras, de inversión, de trading u otro tipo, proporcionadas o respaldadas por TradingView. Obtenga más información en Condiciones de uso.
Publicaciones relacionadas
Exención de responsabilidad
La información y las publicaciones no constituyen, ni deben considerarse como, asesoramiento o recomendaciones financieras, de inversión, de trading u otro tipo, proporcionadas o respaldadas por TradingView. Obtenga más información en Condiciones de uso.