
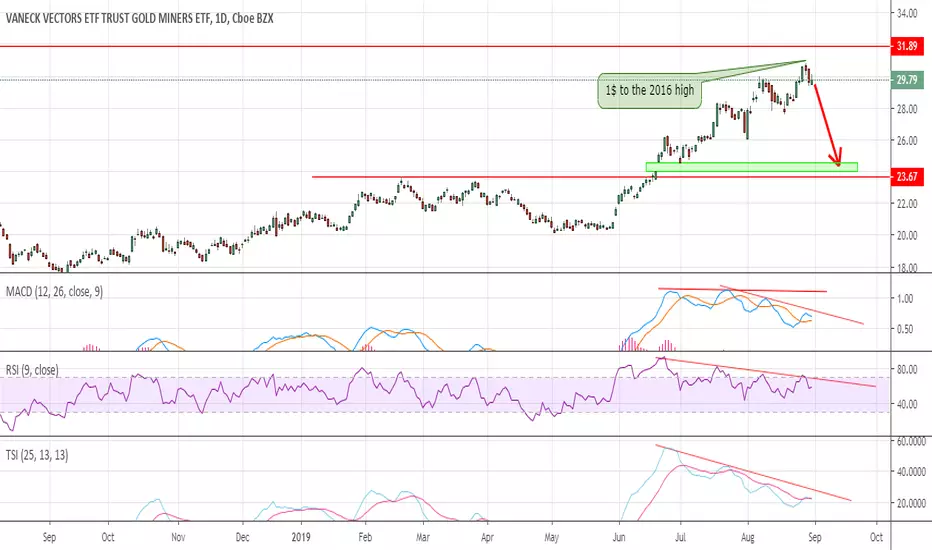
I think the GDX rally is done too.
All the indicators are showing divergencies in GDX.
It rallied almost to the 2016 highs...

We will get a pinbar ( inverted hammer or shooting star ) on the weekly chart.
The weekly chart's indicators need to tag the oversold territory in this decline.
It might close the gap at 24 -24.56 or might test breakout at 23.67$.
All the indicators are showing divergencies in GDX.
It rallied almost to the 2016 highs...
We will get a pinbar ( inverted hammer or shooting star ) on the weekly chart.
The weekly chart's indicators need to tag the oversold territory in this decline.
It might close the gap at 24 -24.56 or might test breakout at 23.67$.
Nota
Broke down the trendline today. If it stays there into the close more selling will come on Monday.Nota
After today's big bounce we are closing in the red. Big guys dumped their shares to the small guys. I hope nobody bought the fake rally today.
Operación cerrada manualmente
Nota
Just in case if it turns out to be a double bottom
Publicaciones relacionadas
Exención de responsabilidad
La información y las publicaciones no constituyen, ni deben considerarse como, asesoramiento o recomendaciones financieras, de inversión, de trading u otro tipo, proporcionadas o respaldadas por TradingView. Obtenga más información en Condiciones de uso.
Publicaciones relacionadas
Exención de responsabilidad
La información y las publicaciones no constituyen, ni deben considerarse como, asesoramiento o recomendaciones financieras, de inversión, de trading u otro tipo, proporcionadas o respaldadas por TradingView. Obtenga más información en Condiciones de uso.