
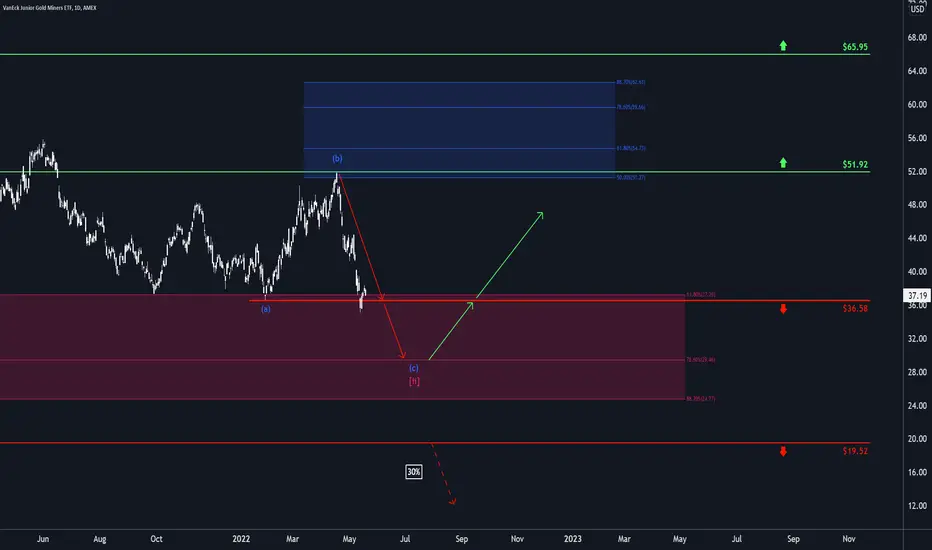
After jumping down from its last high at the lower edge of the blue zone between $51.27 and $62.63, GDXJ has fallen below the mark at $36.58 to test the waters of the magenta zone between $37.26 and $24.77. We expect it to gather more downward pressure to advance deeper into the magenta zone, where it should finish wave ii in magenta. Then, the ETF should turn around and climb back above $36.58. From there, it should continue the ascent towards the resistance at $51.92. However, there is a 30% chance that GDXJ could break through the magenta zone and subsequently drop below the support at $19.52 instead.

📊 Daily market insights combining macro + Elliott Wave analysis
🚀 Spot trends early with momentum, sentiment & price structure
🌐 Join thousands trading smarter at hkcmglobal.com
🚀 Spot trends early with momentum, sentiment & price structure
🌐 Join thousands trading smarter at hkcmglobal.com
Publicaciones relacionadas
Exención de responsabilidad
La información y las publicaciones no constituyen, ni deben considerarse como, asesoramiento o recomendaciones financieras, de inversión, de trading u otro tipo, proporcionadas o respaldadas por TradingView. Obtenga más información en Condiciones de uso.
📊 Daily market insights combining macro + Elliott Wave analysis
🚀 Spot trends early with momentum, sentiment & price structure
🌐 Join thousands trading smarter at hkcmglobal.com
🚀 Spot trends early with momentum, sentiment & price structure
🌐 Join thousands trading smarter at hkcmglobal.com
Publicaciones relacionadas
Exención de responsabilidad
La información y las publicaciones no constituyen, ni deben considerarse como, asesoramiento o recomendaciones financieras, de inversión, de trading u otro tipo, proporcionadas o respaldadas por TradingView. Obtenga más información en Condiciones de uso.