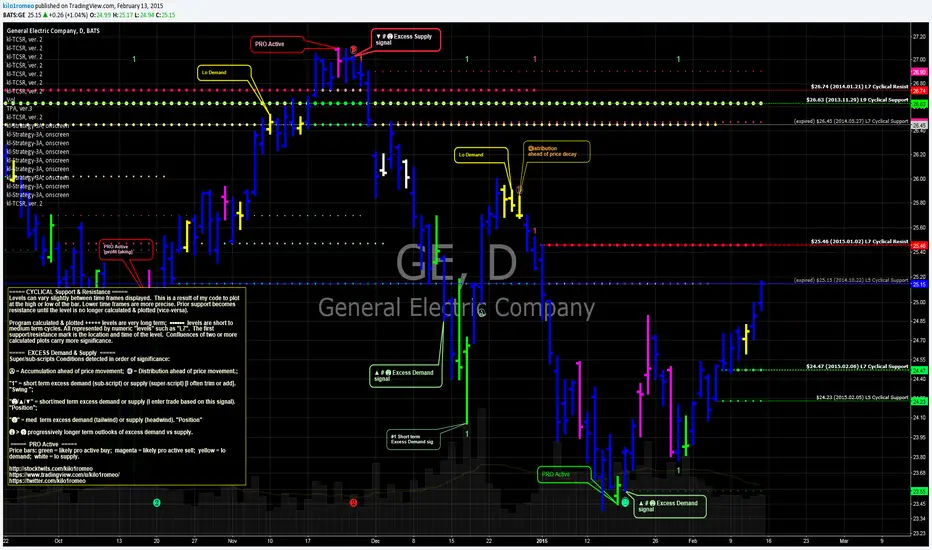
I have begun slowly accumulating  GE in Jan. after the #2 Excess Demand signal on Jan 20. Average is $24.13 with staggered stops below $24.47, $24.23 and $23.55. However, I think the real long term opportunity will present itself on the first pull back after the January bottom. This is shaping up to occur after the $25.48 (approx.) level is tagged. This is my "L7" Cyclical Resist on the chart. The initial bullish target after that pull back is now looking like the mid $26 area at my "L9" Cyclical Support on the chart. Furthermore, I want to see a GE breakout vs
  SPY (see attached chart).
GE in Jan. after the #2 Excess Demand signal on Jan 20. Average is $24.13 with staggered stops below $24.47, $24.23 and $23.55. However, I think the real long term opportunity will present itself on the first pull back after the January bottom. This is shaping up to occur after the $25.48 (approx.) level is tagged. This is my "L7" Cyclical Resist on the chart. The initial bullish target after that pull back is now looking like the mid $26 area at my "L9" Cyclical Support on the chart. Furthermore, I want to see a GE breakout vs SPY (see attached chart).
Exención de responsabilidad
La información y las publicaciones no constituyen, ni deben considerarse como, asesoramiento o recomendaciones financieras, de inversión, de trading u otro tipo, proporcionadas o respaldadas por TradingView. Obtenga más información en Condiciones de uso.
Exención de responsabilidad
La información y las publicaciones no constituyen, ni deben considerarse como, asesoramiento o recomendaciones financieras, de inversión, de trading u otro tipo, proporcionadas o respaldadas por TradingView. Obtenga más información en Condiciones de uso.