
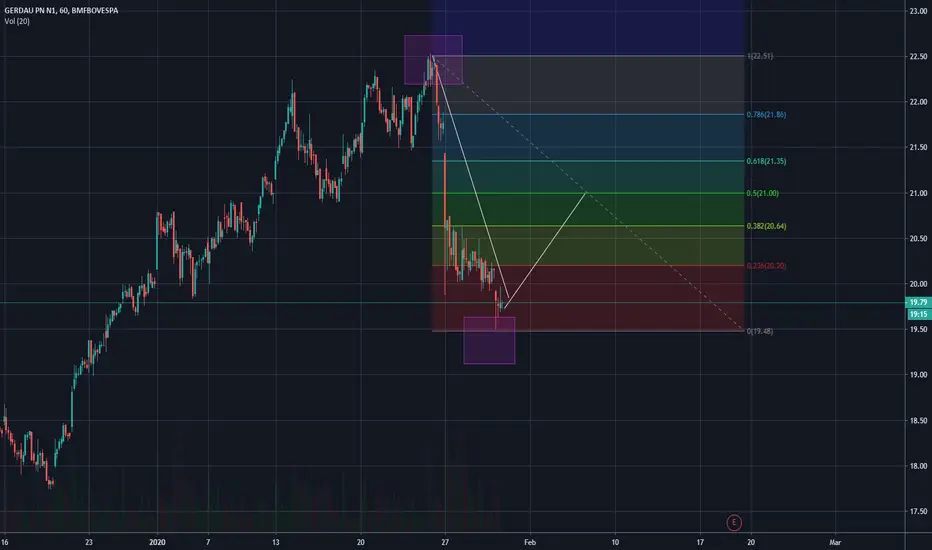
Rectangles represent the maximum and minimum values.
The white line represents the movement that I assume will happen.
The white line represents the movement that I assume will happen.
Nota
Therefore there was a rise up to 0.382, whete my exit point should have been. The line did not cross 0.5, so I will assume it will continue on a low trend.Nota
After the 0.382 retraction, the candles reached 0.5 fibonacci, where was my point of sale.I bought at 19.80 and sold at 20.95 making a 6% profit.

Exención de responsabilidad
La información y las publicaciones no constituyen, ni deben considerarse como, asesoramiento o recomendaciones financieras, de inversión, de trading u otro tipo, proporcionadas o respaldadas por TradingView. Obtenga más información en Condiciones de uso.
Exención de responsabilidad
La información y las publicaciones no constituyen, ni deben considerarse como, asesoramiento o recomendaciones financieras, de inversión, de trading u otro tipo, proporcionadas o respaldadas por TradingView. Obtenga más información en Condiciones de uso.