Largo
Graph link (GLQ)
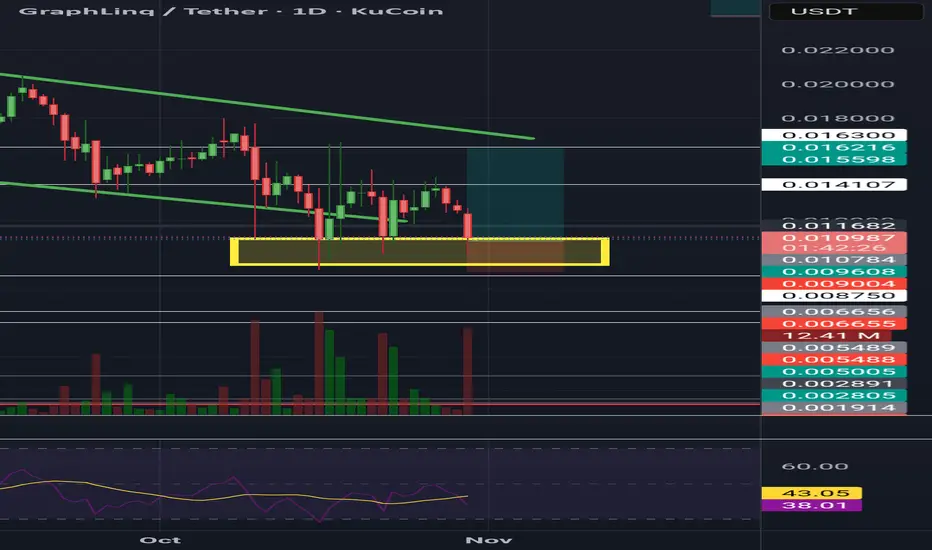
Glq usdt Daily analysis
Time frame daily
Risk rewards ratio >3 👈👌
Target =0.0162 $
Technical analysis
GLQ, as you can see in the image, had been moving within a descending channel for several months.🐻❄️ It eventually broke below the lower boundary of this descending support, signaling a potential drop to traders. Surprisingly, however, the yellow support zone you can see in the chart held very strongly — even after four separate tests, it did not break. This area will be the most important support zone for me, and I do not expect it to be broken at all. Even during the massive crash two weeks ago, when almost all coins experienced drops of up to 70%, this support remained intact.
Time frame daily
Risk rewards ratio >3 👈👌
Target =0.0162 $
Technical analysis
GLQ, as you can see in the image, had been moving within a descending channel for several months.🐻❄️ It eventually broke below the lower boundary of this descending support, signaling a potential drop to traders. Surprisingly, however, the yellow support zone you can see in the chart held very strongly — even after four separate tests, it did not break. This area will be the most important support zone for me, and I do not expect it to be broken at all. Even during the massive crash two weeks ago, when almost all coins experienced drops of up to 70%, this support remained intact.

Exención de responsabilidad
La información y las publicaciones no constituyen, ni deben considerarse como, asesoramiento o recomendaciones financieras, de inversión, de trading u otro tipo, proporcionadas o respaldadas por TradingView. Obtenga más información en Condiciones de uso.
Exención de responsabilidad
La información y las publicaciones no constituyen, ni deben considerarse como, asesoramiento o recomendaciones financieras, de inversión, de trading u otro tipo, proporcionadas o respaldadas por TradingView. Obtenga más información en Condiciones de uso.