
Godrej Properties | Flag Pattern Setup
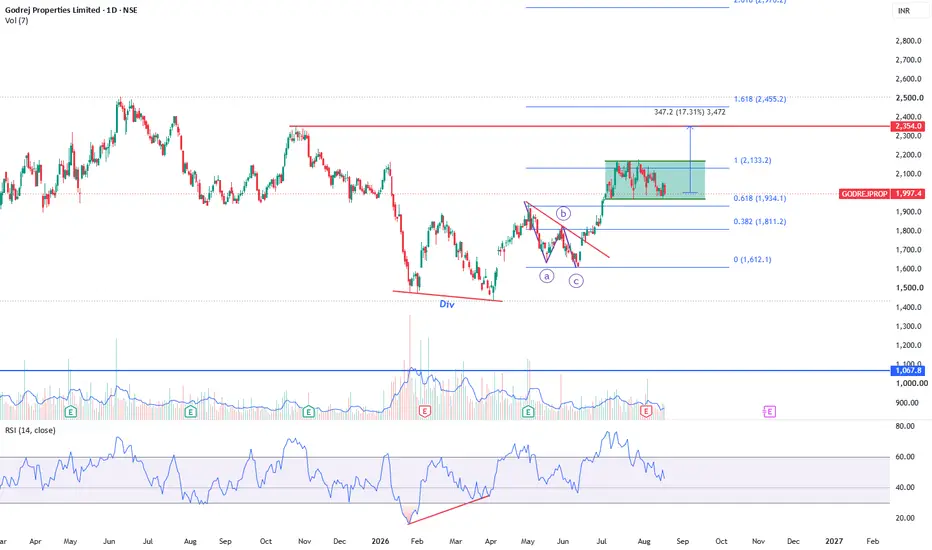
Godrej Properties has shown a strong recovery from the lower levels, supported by a bullish divergence. The stock then gave a breakout from the ABC pattern, confirming improving momentum.
Currently, the stock appears to be forming a Flag Pattern within the Bollinger Bands, which could set up the next potential upward move.
🎯 Target: ₹2,350
📈 Potential upside: 16%+ from current levels
💡 Strategy: Long can be considered around current levels. If the stock dips towards ₹1,900–₹1,950, it can be considered for adding, subject to price action and risk management.
Godrej Properties has shown a strong recovery from the lower levels, supported by a bullish divergence. The stock then gave a breakout from the ABC pattern, confirming improving momentum.
Currently, the stock appears to be forming a Flag Pattern within the Bollinger Bands, which could set up the next potential upward move.
🎯 Target: ₹2,350
📈 Potential upside: 16%+ from current levels
💡 Strategy: Long can be considered around current levels. If the stock dips towards ₹1,900–₹1,950, it can be considered for adding, subject to price action and risk management.

Publicaciones relacionadas
Exención de responsabilidad
La información y las publicaciones no constituyen, ni deben considerarse como, asesoramiento o recomendaciones financieras, de inversión, de trading u otro tipo, proporcionadas o respaldadas por TradingView. Obtenga más información en Condiciones de uso.
Publicaciones relacionadas
Exención de responsabilidad
La información y las publicaciones no constituyen, ni deben considerarse como, asesoramiento o recomendaciones financieras, de inversión, de trading u otro tipo, proporcionadas o respaldadas por TradingView. Obtenga más información en Condiciones de uso.