
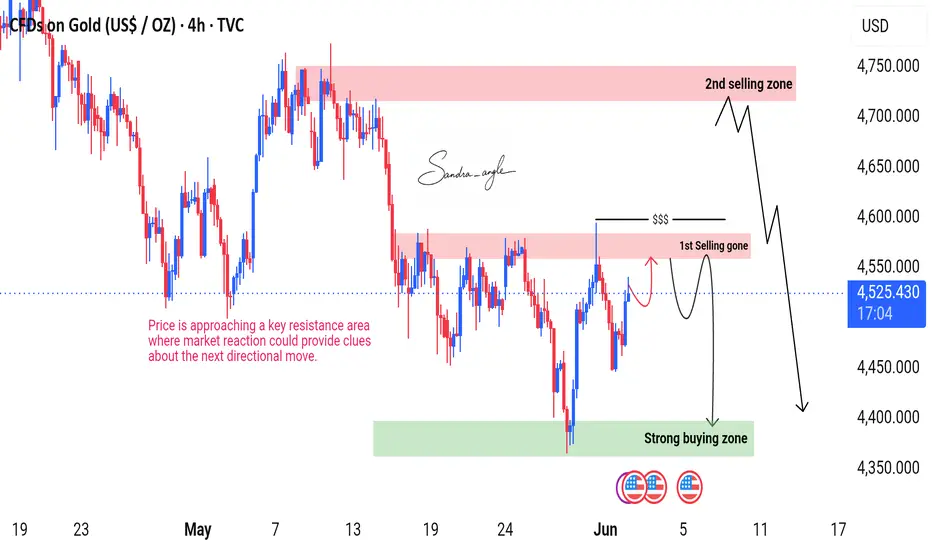
Gold remains within a broader corrective phase after failing to sustain momentum near the upper resistance region. The chart highlights multiple supply and demand zones that traders may monitor for potential reactions. Price recently rebounded from a key support area and is currently approaching a nearby resistance zone, where selling pressure could emerge if bullish momentum weakens.
Key Technical Zones
Resistance Zone 1 The first highlighted supply area is positioned above the current market price. This region previously acted as resistance and may attract selling interest if price revisits it. Traders often watch for rejection candles, reduced buying momentum, or lower-timeframe bearish confirmations before considering any directional bias.
Resistance Zone 2 A higher supply area is marked near previous swing highs. If buyers successfully push through the first resistance zone, price could test this upper region. Historically, such areas can become important decision points where market participants reassess valuation and liquidity conditions.

H1 rejection zone
Support Zone The green demand area represents a region where buyers previously entered the market and generated a strong upward reaction. As long as price remains above this zone, market participants may continue to monitor it as a potential area of support. A revisit could attract renewed buying interest, although no outcome is guaranteed.
Current Price Behaviour
Price has recovered from the recent support area and is trading between major demand and supply zones. This suggests a range-bound environment where market participants may wait for a decisive move before establishing stronger directional conviction.
The illustrated path on the chart represents one possible scenario in which price first tests resistance before seeking direction. However, market movements are inherently uncertain, and actual price action may differ significantly from any projected path.

M30 rejection zone
What Traders May Watch
Reaction around the first resistance zone.
Whether price can establish acceptance above resistance or shows signs of rejection.
Volume and momentum characteristics during any breakout attempt.
Behaviour around the marked demand zone if price retraces lower.
Upcoming economic releases and market sentiment that may influence volatility.
Educational Note
This chart reflects a technical analysis viewpoint based on historical price behaviour, support and resistance concepts, and market structure observations. It is intended solely for educational and informational purposes and should not be interpreted as financial advice, investment advice, or a guarantee of future market performance. All trading involves risk, and past price action does not predict future results.
Disclaimer
The ideas presented are personal market observations for educational purposes only. They do not constitute a recommendation to buy or sell any financial instrument. Always conduct your own research, apply proper risk management, and consider multiple factors before making trading decisions. Market conditions can change without notice, and any scenario shown on the chart is hypothetical rather than predictive.
Key Technical Zones
Resistance Zone 1 The first highlighted supply area is positioned above the current market price. This region previously acted as resistance and may attract selling interest if price revisits it. Traders often watch for rejection candles, reduced buying momentum, or lower-timeframe bearish confirmations before considering any directional bias.
Resistance Zone 2 A higher supply area is marked near previous swing highs. If buyers successfully push through the first resistance zone, price could test this upper region. Historically, such areas can become important decision points where market participants reassess valuation and liquidity conditions.
H1 rejection zone
Support Zone The green demand area represents a region where buyers previously entered the market and generated a strong upward reaction. As long as price remains above this zone, market participants may continue to monitor it as a potential area of support. A revisit could attract renewed buying interest, although no outcome is guaranteed.
Current Price Behaviour
Price has recovered from the recent support area and is trading between major demand and supply zones. This suggests a range-bound environment where market participants may wait for a decisive move before establishing stronger directional conviction.
The illustrated path on the chart represents one possible scenario in which price first tests resistance before seeking direction. However, market movements are inherently uncertain, and actual price action may differ significantly from any projected path.
M30 rejection zone
What Traders May Watch
Reaction around the first resistance zone.
Whether price can establish acceptance above resistance or shows signs of rejection.
Volume and momentum characteristics during any breakout attempt.
Behaviour around the marked demand zone if price retraces lower.
Upcoming economic releases and market sentiment that may influence volatility.
Educational Note
This chart reflects a technical analysis viewpoint based on historical price behaviour, support and resistance concepts, and market structure observations. It is intended solely for educational and informational purposes and should not be interpreted as financial advice, investment advice, or a guarantee of future market performance. All trading involves risk, and past price action does not predict future results.
Disclaimer
The ideas presented are personal market observations for educational purposes only. They do not constitute a recommendation to buy or sell any financial instrument. Always conduct your own research, apply proper risk management, and consider multiple factors before making trading decisions. Market conditions can change without notice, and any scenario shown on the chart is hypothetical rather than predictive.

Publicaciones relacionadas
Exención de responsabilidad
La información y las publicaciones no constituyen, ni deben considerarse como, asesoramiento o recomendaciones financieras, de inversión, de trading u otro tipo, proporcionadas o respaldadas por TradingView. Obtenga más información en Condiciones de uso.
Publicaciones relacionadas
Exención de responsabilidad
La información y las publicaciones no constituyen, ni deben considerarse como, asesoramiento o recomendaciones financieras, de inversión, de trading u otro tipo, proporcionadas o respaldadas por TradingView. Obtenga más información en Condiciones de uso.