
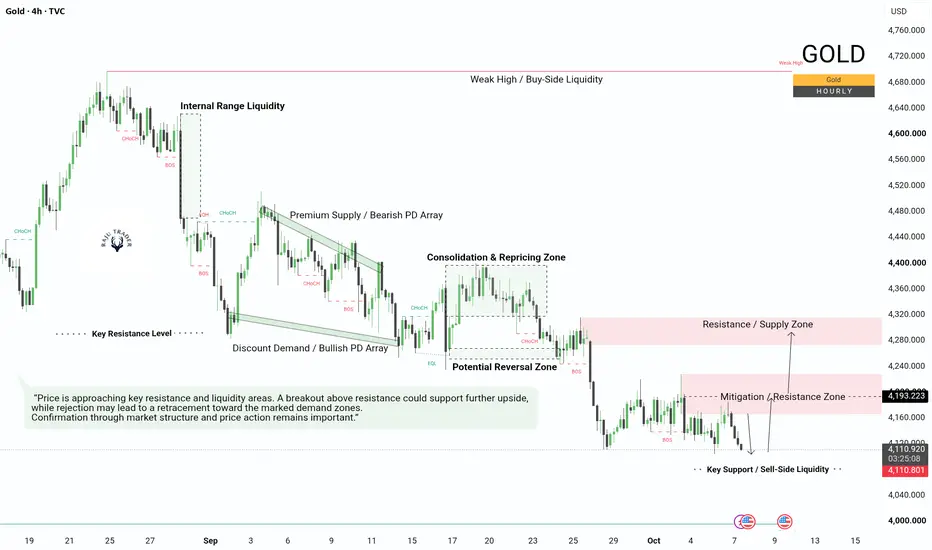
This chart provides an educational view of Gold price action by combining market structure, liquidity, support and resistance, and key trading zones. The marked levels help identify where price has previously reacted and where significant buying or selling interest may develop. The upper zones represent areas of potential resistance and supply, while the lower zones highlight support and demand areas where buyers may become active.
The 4,291 level is an important reference point within the current structure and may act as a key resistance/liquidity area. If price breaks and holds above this level with strong momentum, it may indicate further bullish price delivery. Conversely, rejection from the level could lead to a retracement toward the marked support and demand zones.
The chart also highlights consolidation areas and the broader price channel, helping to understand how price moves between support and resistance before a decisive breakout or breakdown. From an ICT/SMC perspective, liquidity around previous highs and lows can act as potential price targets, while market structure shifts and displacement can provide confirmation of a directional move.
The overall purpose is to study how liquidity, structure, supply, demand, and price action interact—not to assume that every marked zone will produce a reversal. Confirmation through price action and market structure should always be considered before making a trading decision.
The 4,291 level is an important reference point within the current structure and may act as a key resistance/liquidity area. If price breaks and holds above this level with strong momentum, it may indicate further bullish price delivery. Conversely, rejection from the level could lead to a retracement toward the marked support and demand zones.
The chart also highlights consolidation areas and the broader price channel, helping to understand how price moves between support and resistance before a decisive breakout or breakdown. From an ICT/SMC perspective, liquidity around previous highs and lows can act as potential price targets, while market structure shifts and displacement can provide confirmation of a directional move.
The overall purpose is to study how liquidity, structure, supply, demand, and price action interact—not to assume that every marked zone will produce a reversal. Confirmation through price action and market structure should always be considered before making a trading decision.

t.me/MR_RAJO_TRADER
What You’ll Get
Daily Forex Market Insights
Fundamental,Technical Market Analysis
Professional Risk Management Strategies
Capital Protection,Quality Market Opportunities Based on Analysis
t.me/MR_RAJO_TRADER
What You’ll Get
Daily Forex Market Insights
Fundamental,Technical Market Analysis
Professional Risk Management Strategies
Capital Protection,Quality Market Opportunities Based on Analysis
t.me/MR_RAJO_TRADER
Publicaciones relacionadas
Exención de responsabilidad
La información y las publicaciones no constituyen, ni deben considerarse como, asesoramiento o recomendaciones financieras, de inversión, de trading u otro tipo, proporcionadas o respaldadas por TradingView. Obtenga más información en Condiciones de uso.
t.me/MR_RAJO_TRADER
What You’ll Get
Daily Forex Market Insights
Fundamental,Technical Market Analysis
Professional Risk Management Strategies
Capital Protection,Quality Market Opportunities Based on Analysis
t.me/MR_RAJO_TRADER
What You’ll Get
Daily Forex Market Insights
Fundamental,Technical Market Analysis
Professional Risk Management Strategies
Capital Protection,Quality Market Opportunities Based on Analysis
t.me/MR_RAJO_TRADER
Publicaciones relacionadas
Exención de responsabilidad
La información y las publicaciones no constituyen, ni deben considerarse como, asesoramiento o recomendaciones financieras, de inversión, de trading u otro tipo, proporcionadas o respaldadas por TradingView. Obtenga más información en Condiciones de uso.