
Gold Market Outlook | Structure, Trend & Important Reaction Area
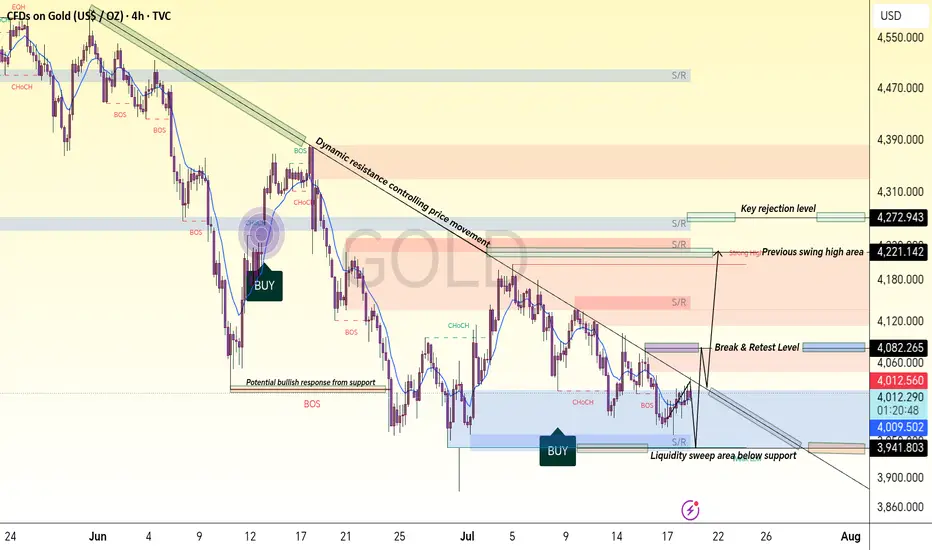
This 4H Gold (XAUUSD) chart represents a complete price action and Smart Money Concept analysis, focusing on market structure, liquidity movement, and key institutional reaction zones. The chart highlights how price is moving within a broader bearish structure while approaching important demand and support areas where buyers may show interest.
The market has been respecting a dynamic resistance trendline, creating a sequence of lower highs and lower lows. This confirms the importance of monitoring bearish pressure and waiting for proper confirmation before expecting any major reversal. The marked resistance zones represent areas where sellers previously controlled the market and where rejection can occur again.
The highlighted support and demand zones show potential liquidity collection areas where price may search for resting orders before making the next directional move. The liquidity sweep area below support is an important zone because smart money often targets weak lows before creating a strong reaction.
Key levels on the chart include:
Dynamic Resistance: Trendline controlling bearish price movement and acting as a barrier for bullish attempts.
Break & Retest Level: Important area where previous resistance/support behavior can decide the next move.
Previous Swing High Area: Major reaction zone where buyers and sellers may fight for control.
Key Rejection Level: Higher resistance area where selling pressure can appear.
Liquidity Sweep Area: Zone where market may collect liquidity before expansion.
Demand Zone / Buyer Interest Area: Region where buyers may defend price and create a possible structure shift.
The chart also tracks important Smart Money Concepts such as Break of Structure (BOS), Change of Character (CHoCH), liquidity grabs, and institutional order flow. Price reaction from these zones will determine whether the market continues bearish momentum or starts a new bullish recovery.
This analysis is created for educational purposes to understand market behavior, liquidity, and professional price action techniques. Always wait for confirmation, manage risk properly, and avoid emotional trading decisions.
The market has been respecting a dynamic resistance trendline, creating a sequence of lower highs and lower lows. This confirms the importance of monitoring bearish pressure and waiting for proper confirmation before expecting any major reversal. The marked resistance zones represent areas where sellers previously controlled the market and where rejection can occur again.
The highlighted support and demand zones show potential liquidity collection areas where price may search for resting orders before making the next directional move. The liquidity sweep area below support is an important zone because smart money often targets weak lows before creating a strong reaction.
Key levels on the chart include:
Dynamic Resistance: Trendline controlling bearish price movement and acting as a barrier for bullish attempts.
Break & Retest Level: Important area where previous resistance/support behavior can decide the next move.
Previous Swing High Area: Major reaction zone where buyers and sellers may fight for control.
Key Rejection Level: Higher resistance area where selling pressure can appear.
Liquidity Sweep Area: Zone where market may collect liquidity before expansion.
Demand Zone / Buyer Interest Area: Region where buyers may defend price and create a possible structure shift.
The chart also tracks important Smart Money Concepts such as Break of Structure (BOS), Change of Character (CHoCH), liquidity grabs, and institutional order flow. Price reaction from these zones will determine whether the market continues bearish momentum or starts a new bullish recovery.
This analysis is created for educational purposes to understand market behavior, liquidity, and professional price action techniques. Always wait for confirmation, manage risk properly, and avoid emotional trading decisions.
Operación activa
XAUUSD Trade Update
Trade is active from 4000 and price has successfully reached 4082, achieving +820 pips running profit.
The setup is moving according to the planned analysis and respecting the key market structure levels. Maintain discipline and follow the trading plan.
✅ +820 Pips Running Profit Secured
✅ Hold the remaining position for the last target 🎯
✅ Follow risk management rules and protect the trade
✅ Avoid emotional exits and wait for confirmation
Strong momentum continues — stay patient and let the trade reach the planned target. 📈

t.me/+HstI692sUGw0ZmRk
✅ MY FREE SIGNALS CHANNEL
✅ PERSONAL TELEGRAM
✅ FOREX BROKER USED
t.me/+pg7FHDH9Zl40MGJk
✅ MY FREE SIGNALS CHANNEL
✅ PERSONAL TELEGRAM
✅ FOREX BROKER USED
t.me/+pg7FHDH9Zl40MGJk
Publicaciones relacionadas
Exención de responsabilidad
La información y las publicaciones no constituyen, ni deben considerarse como, asesoramiento o recomendaciones financieras, de inversión, de trading u otro tipo, proporcionadas o respaldadas por TradingView. Obtenga más información en Condiciones de uso.
t.me/+HstI692sUGw0ZmRk
✅ MY FREE SIGNALS CHANNEL
✅ PERSONAL TELEGRAM
✅ FOREX BROKER USED
t.me/+pg7FHDH9Zl40MGJk
✅ MY FREE SIGNALS CHANNEL
✅ PERSONAL TELEGRAM
✅ FOREX BROKER USED
t.me/+pg7FHDH9Zl40MGJk
Publicaciones relacionadas
Exención de responsabilidad
La información y las publicaciones no constituyen, ni deben considerarse como, asesoramiento o recomendaciones financieras, de inversión, de trading u otro tipo, proporcionadas o respaldadas por TradingView. Obtenga más información en Condiciones de uso.